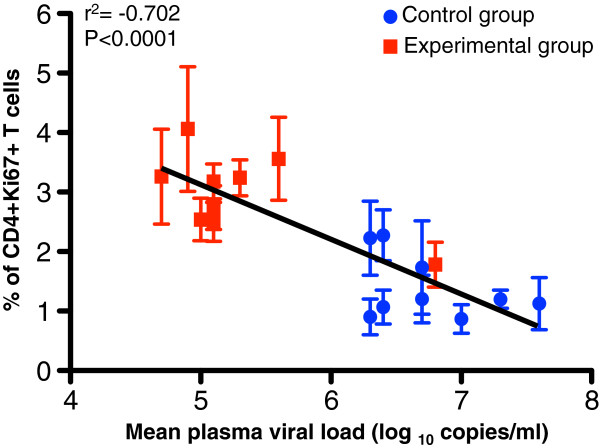
Figure 3.
An inverse correlation is shown between the CD3+CD4+ T-cell proliferation responses and plasma viral load in Experimental group (red squares, n = 5) and Control groups (blue circles, n = 4) of macaques following SIVMAC251challenge for all timepoints from d14 and d231. Note that the lower viral loads demonstrated in the EG showed higher % of CD4+Ki67+ T-cells while the CG that had much higher viral loads had a lower % of CD4+Ki67+ T-cells. Interestingly, the one exception in EG overall trend was the high viral load at the d14 peak, yet the correlation held and at that point, the % of CD4+Ki67+ T-cells was low. Linear regression analysis of proliferating CD4+ T-cells and mean plasma viral load from all macaques was calculated using GraphPad Prism (version 5.0d, GraphPad software, CA).

