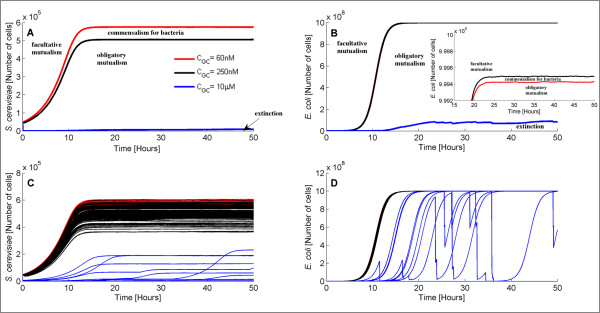
Figure 4.
Average values and single trajectories of S. cerevisiae andE. coli population for different Gc concentrations. Average (over 100 trajectories) values (A,B) and 100 single trajectories (C,D) of S. cerevisiae and E. coli population size for Gc concentration equal to 60 nM (red), 250 nM (black) and 10 μM(blue). The synthetic ecosystem adopts different behaviors, that are commonly observed in natural ecosystems, in response to different Gc concentrations.

