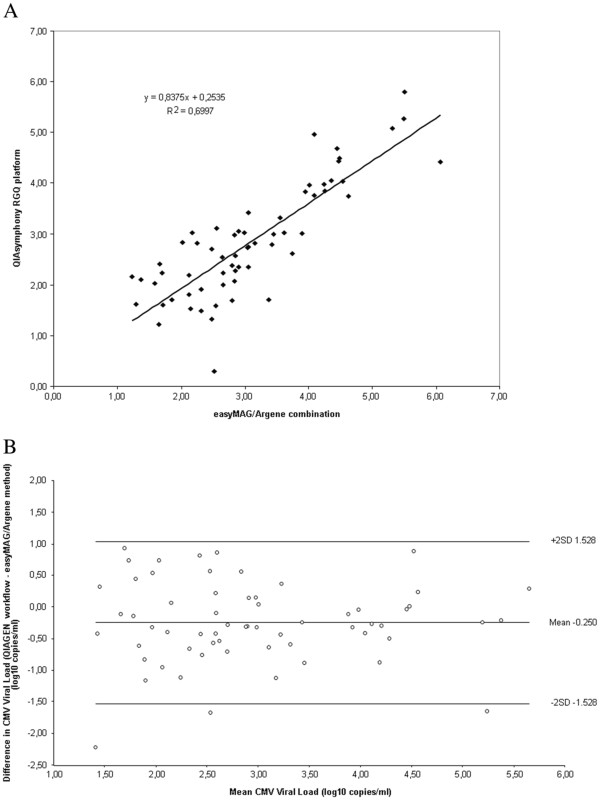
Figure 3.
Correlation analysis using clinical samples. (A) Comparison of CMV DNA load by QIAsymphony RGQ platform and easyMAG/Argene combination using whole blood samples (N=62). The results are expressed in log10 copies/ml. (B) Difference in quantitation between QIAsymphony RGQ platform and easyMAG/Argene combination. Each point represents the difference observed between the results of the 2 methods against their mean. The standard deviation (SD) is 0.639.

