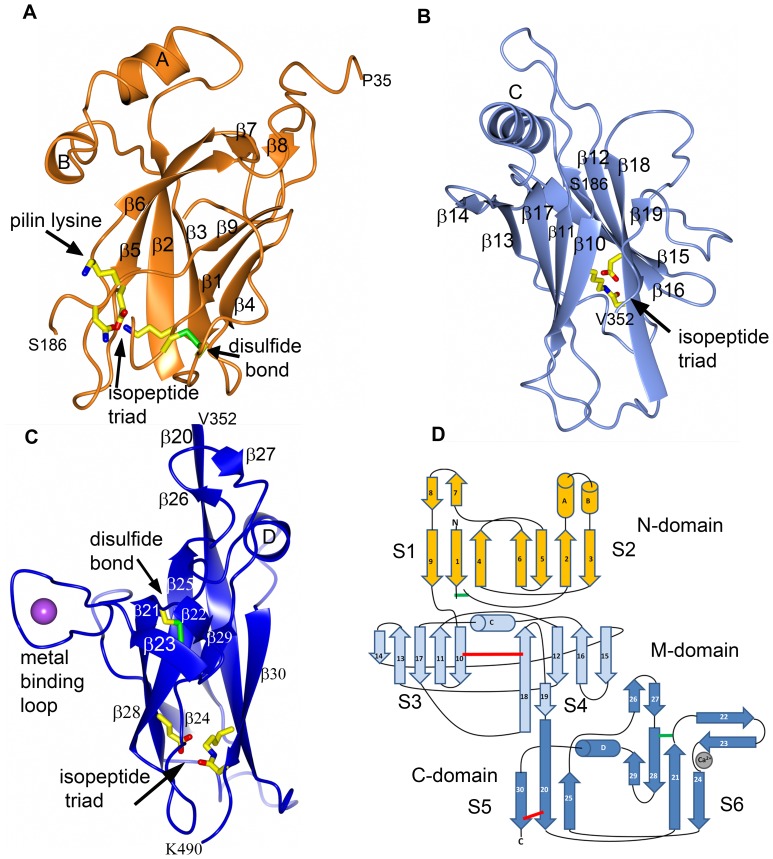
Figure 3. Domains and topology diagram.
Each domain (N-, M- and C-) with labeled secondary structure. A: N-domain in coral, B: M-domain in light blue, C: C-domain in blue. The Ca2+ ion is depicted as a magenta sphere. D: Topology diagram of FimP with domains colored as in A–C. The isopeptides are depicted as red, and disulfides as green, bars. The Ca2+ ion coordinated by the loop is shown as a grey sphere.

