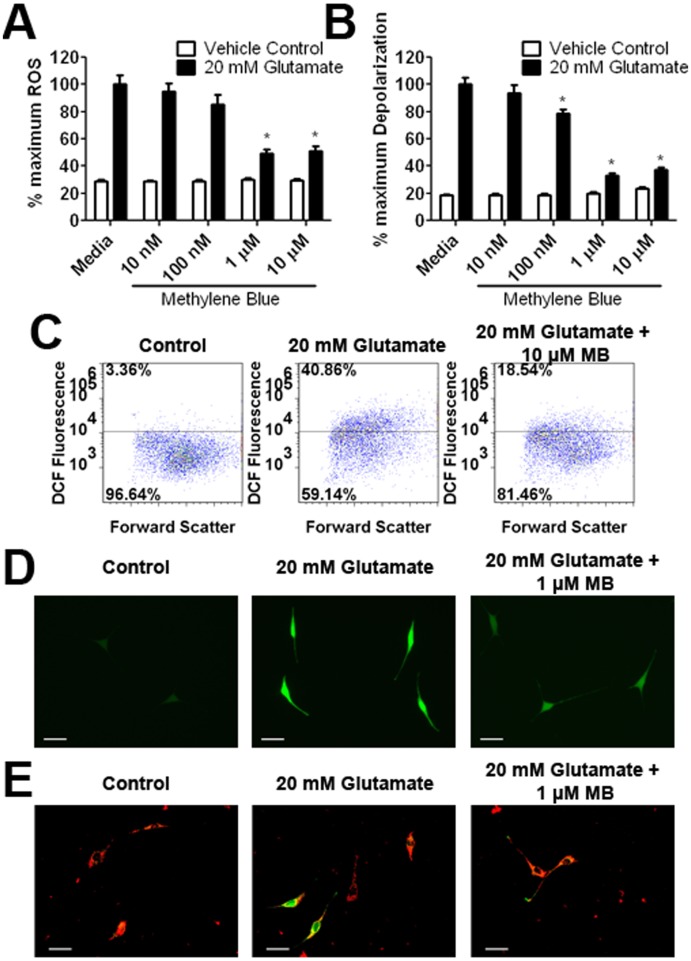
Figure 3. Effect of MB on ROS production and mitochondrial membrane potential depolarization induced by glutamate in HT-22 cells.
(A) DCF microplate reader assay depicts that a significant increase of ROS was induced by a 12 hour exposure to 20 mM glutamate, which was dose dependently attenuated MB. (B) TMRE/NAO plate reader assay depicts a significant mitochondria membrane potential depolarization induced by glutamate insult, which was dose dependently attenuated by MB. (C) Representative DCF flow cytometry assay depicts increase of ROS induced by 8 hour exposure of 10 mM glutamate which was attenuated by 10 µM MB. (D) Representative images of DCF fluorescence demonstrated increased cellular ROS after 8 hours exposure to 20 mM glutamate. DCF fluorescence was reduced with co-treatment of 1 µM MB (scale bar 50 µm). (E) Representative images of JC-1 fluorescence indicate mitochondria membrane potential collapse after an 8 hour exposure to 20 mM glutamate, which was attenuated by co-treatment of 1 µM MB (scale bar 50 µm). * p<0.05 compared to 20 mM glutamate media.

