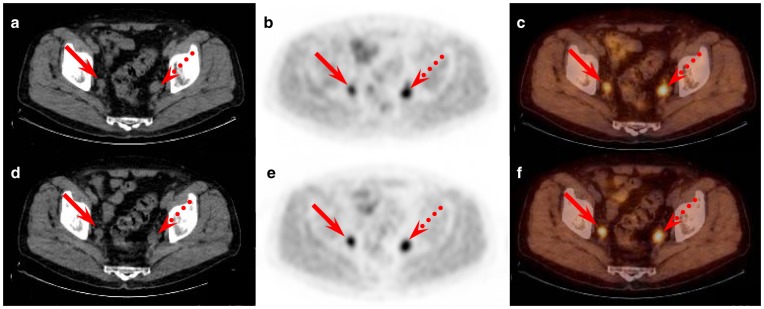
Figure 4. Example of increasing [18F]FCH uptake over time.
Example of increasing [18F]FCH uptake over time in a right para-iliac lymph node (red solid arrow; SUVmax early: 3.02; SUVmax late: 4.35) and a left para-iliac node (red dotted arrow; SUVmax early: 3.47; SUVmax late: 4.79) of a patient with biological relapse after initially treated prostate cancer. These lymph nodes were classified as malignant. Transversal sections of the Low-dose CT, PET and fused PET-CT images: a, b and c – early phase; d, e and f – late phase.

