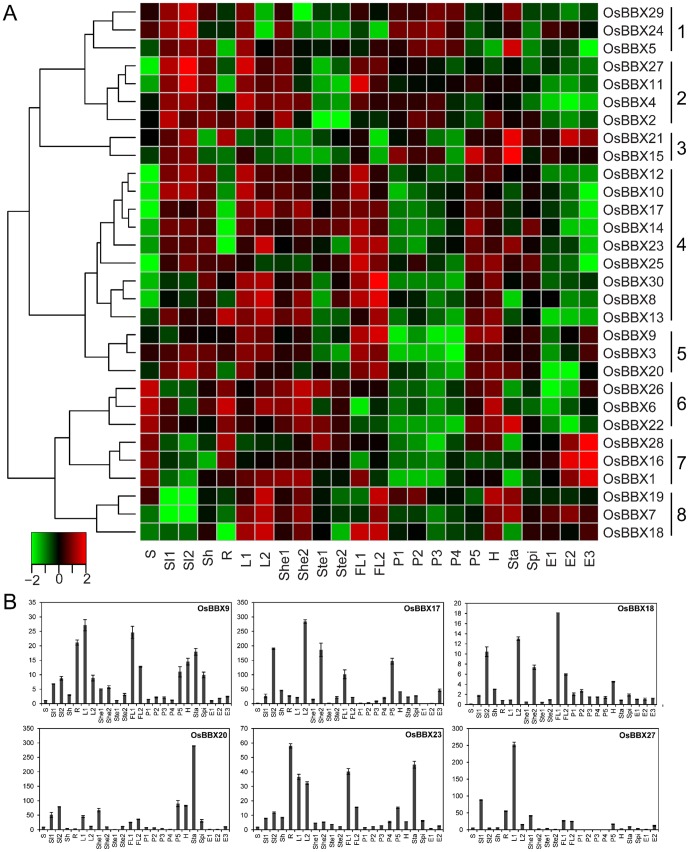
Figure 6. Expression profile of the OsBBX genes in the whole life-cycle of ZS97.
(A) Hierarchical cluster displaying the expression profiles of the 30 OsBBX genes. The tissues used for the expression profiling are indicated at the bottom of each column. A cluster dendrogram is shown on the left. The color key at the bottom represents the Z-score values transformed from log2-based expression values. The qPCR verification results of some of the OsBBX genes are shown (B). The x-axis of the qPCR results shows samples as listed in Table S1. The y-axis is the relative expression level of each gene compared to its expression level in the Endosperm 1 tissue. The error bars indicate the standard deviations of the independent biological replicates.

