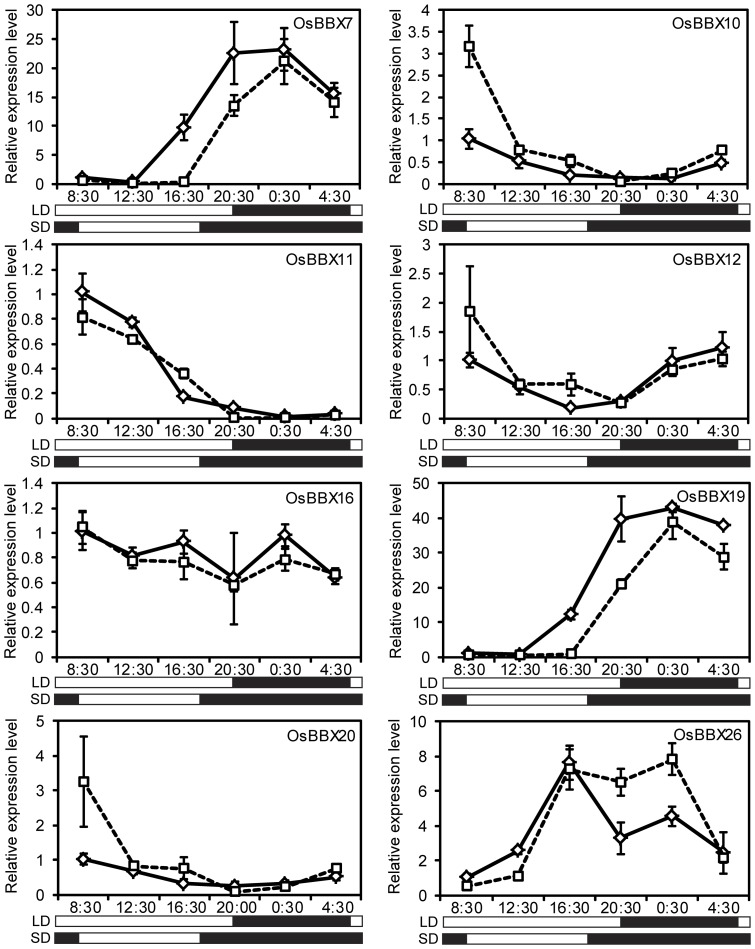
Figure 8. qPCR analysis of the diurnal expression patterns of the OsBBX genes.
The white and black bars at the bottom indicate the light and dark periods, respectively. The numbers above the bars indicate the time of the day. The y-axis shows the relative transcript levels of each gene. The error bars indicate the standard deviations of the independent biological replicates.

