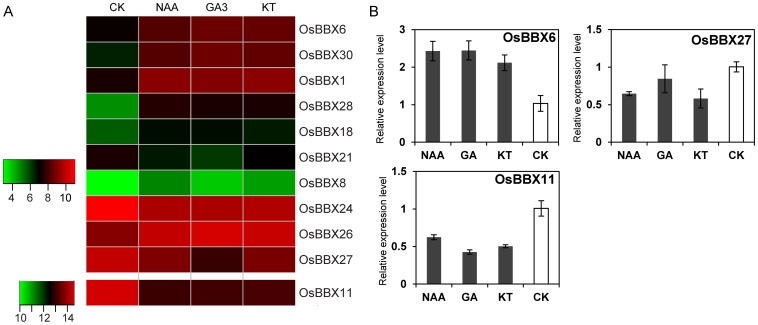
Figure 9. Expression profiles of the OsBBX genes in response to phytohormone treatments.
(A) Hierarchical cluster displaying the differentially expressed OsBBX genes under NAA, GA3 and KT treatments. The color key at the left represents the log2-based expression values. (B) The qPCR verification of some of the differentially expressed OsBBX genes. The x-axis indicates the treatment. The y-axis shows the relative expression level of each treatment compared to control. The error bars indicate the standard deviations of the independent biological replicates.

