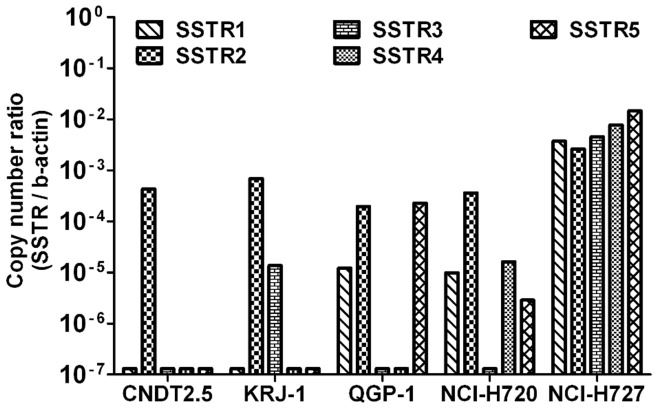
Figure 1. SSTR1, SSTR2, SSTR3, SSTR4 and SSTR5 gene expression analysis.
SSTR1-5 gene expression analysis was performed by QRT-PCR on total RNA from five human NET cell lines: CNDT2.5, KRJ-1, QGP-1, NCI-H720 and NCI-H727. The absolute mRNA copy numbers are adjusted by β-actin mRNA copy number. Results were plotted using the 2−ΔΔCt method with β-actin expression (set to 1) from each individual sample as endogenous reference.

