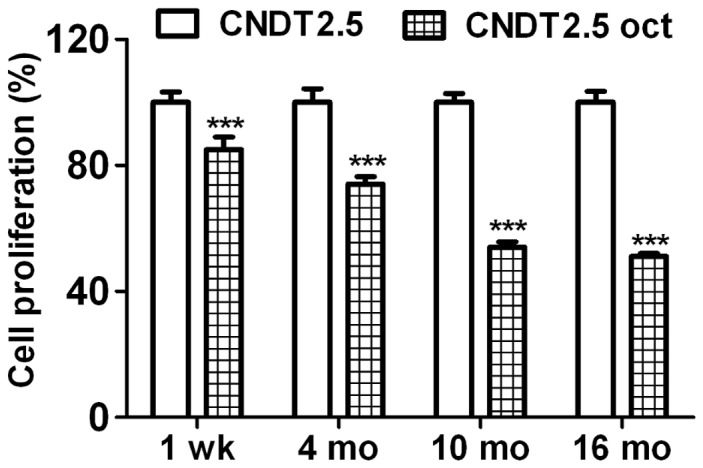
Figure 2. CNDT2.5 cells growth in the presence of 1 µM octreotide was kinetically evaluated.

Cells were cultured in the absence or presence of 1 µM octreotide (oct). WST-1 assay was used to evaluate cell growth. Cell proliferation ratio for each time point was converted to a percentage of the mean value relative to CNDT2.5 cells growth, set to 100%. Plotted results are means ± SD from triplicate wells. Significance was calculated by using Two-Way ANOVA followed by Bonferroni test; comparing with untreated CNDT2.5 cells. *** = p<0.001.
