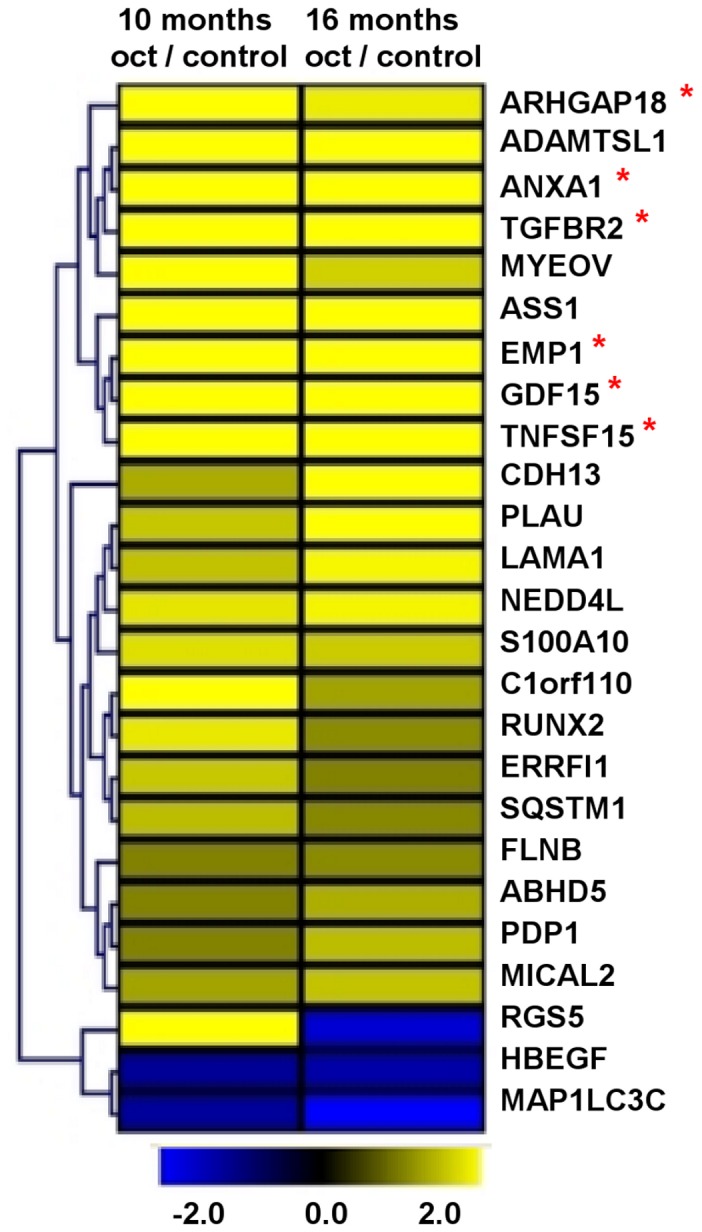
Figure 3. Gene expression of CNDT2.5 cells and 1 µM octreotide treated cells.

Microarray analysis detected 25 differentially expressed genes in octreotide treated CNDT2.5 cells compared to CNDT2.5 untreated cells (control). Upregulated genes are in yellow and downregulated genes are in blue. Genes were clustered according to Euclidian distance, as indicated in the figure. Of the 25 genes, 6 were selected for further analysis and they are indicated by a red asterisk.
