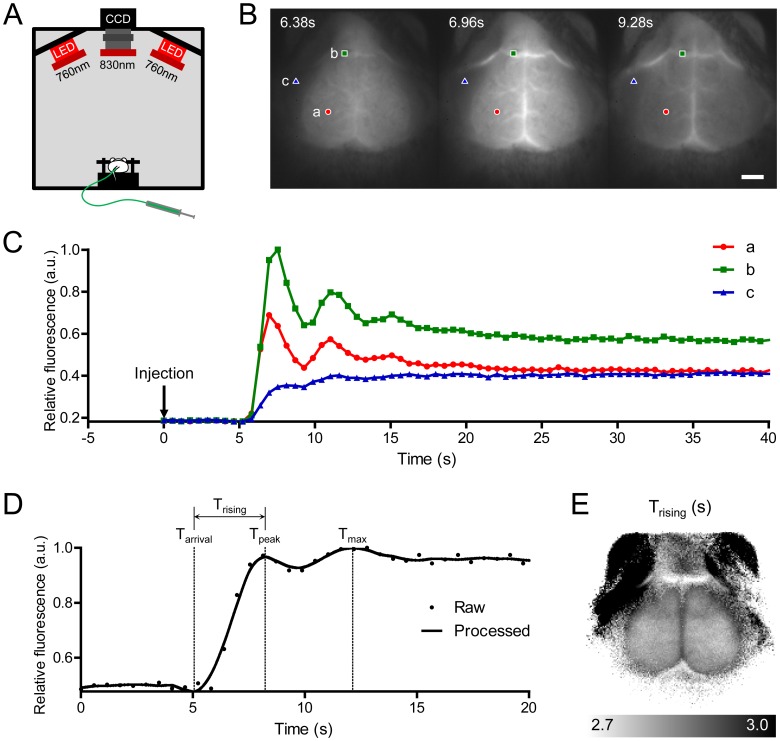
Figure 1. Time-series fluorescence imaging of indocyanine green (ICG) on a mouse head and generation of a cerebral blood flow (CBF) map.
(A) Schematic of imaging setup. (B) Time-series acquisition of fluorescence images after intravenous bolus injection of ICG. The scalp was excised and the bregma was positioned at the center of the images (scale bar: 2 mm). (C) ICG dynamics in three pixels after injection of an ICG bolus, indicated in (B). Different regions of interest are indicated by colored shapes (red circle, cerebrum; green rectangle, large vein; blue triangle, skeletal muscle). (D) Smoothed and interpolated dynamics were plotted as a solid line, and the arrival time (Tarrival) and the first peak time (Tpeak) for calculating the rising time (Trising) are indicated on the time axis. (E) A representative CBF map drawn using the Trising parameter. CCD, charge-coupled device; LED, light-emitting diode; a.u., arbitrary unit; Tmax, maximum intensity time.

