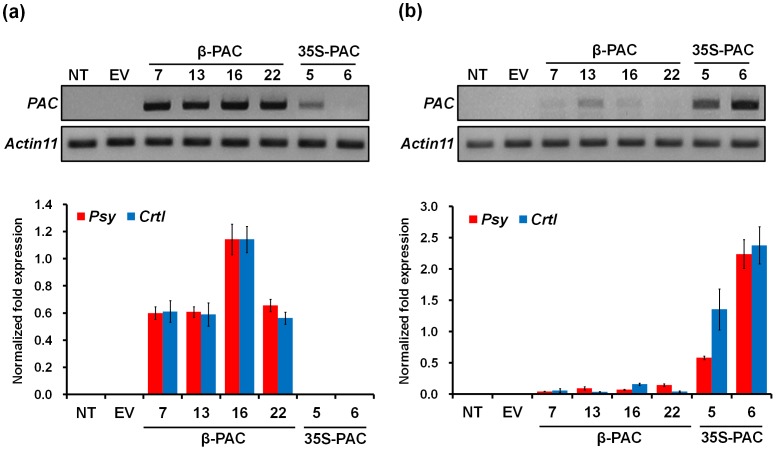
Figure 5. Reverse-transcriptase PCR (upper) and quantitative real-time (bottom) analyses of β-PAC and 35S-PAC transgenic soybean lines.
(a) Seeds. (b) Leaves. NT, non-transgenic plants; EV, empty vector transgenic plants. The 7, 13, 16 and 22 β-PAC transgenic lines and 5 and 6 35S-PAC transgenic lines were analyzed at the T2 generation. The Actin11 gene was used as the normalization control for both the seed and leaf RNA levels.

