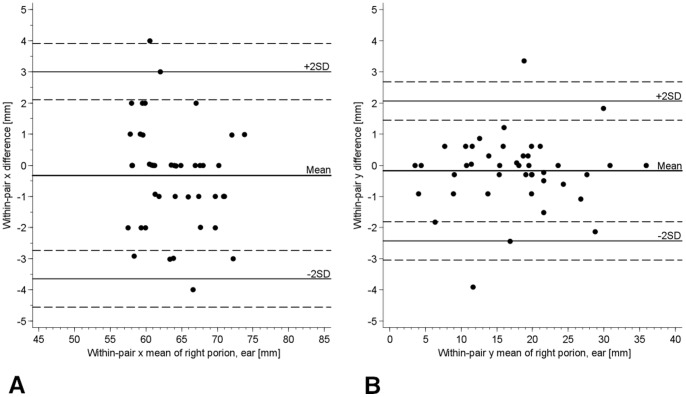
Figure 4. Bland-Altman Plot for Examiner 1 vs. Examiner 5.
a) In x coordinate of right Porion. The horizontal lines represent the mean within-pair difference (−0.32 for examiner 5– examiner 1), the mean ±1.96 standard deviations (1 SD = 1.70), and the mean ±1.96 SD ± square root (3*SD2/n) for 95% CIs of limits of mean ±1.96 standard deviations. b) In y coordinate of right Porion.

