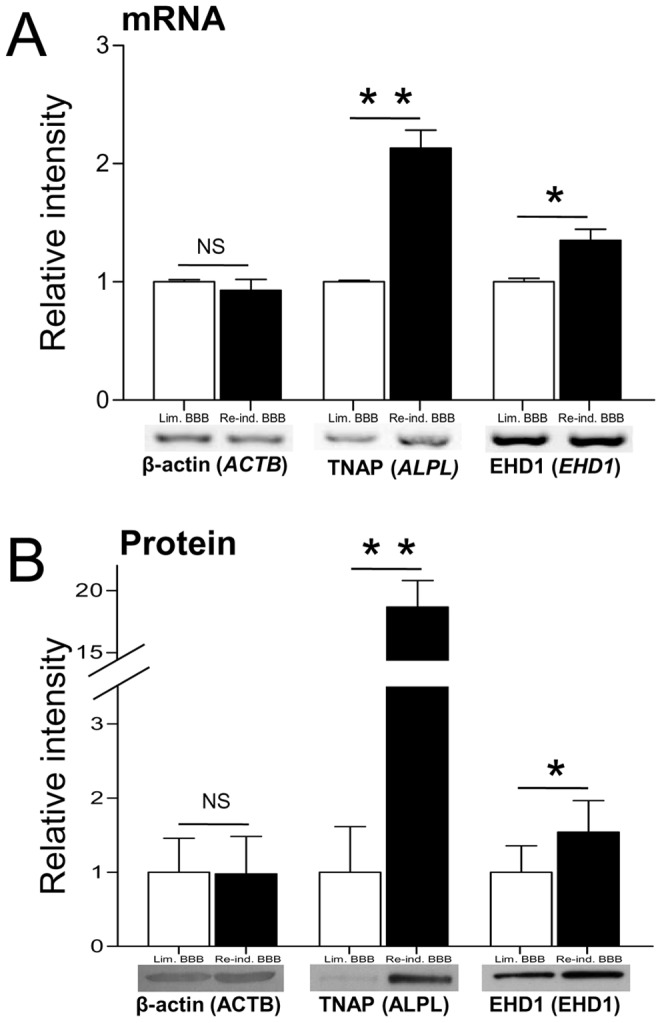
Figure 3. RT-PCR and immunoblotting: confirmation of quantitative changes.

(A) RT-PCR analysis: β-actin (ACTB), TNAP (ALPL) and EHD1 (EHD1) mRNA expression detected by RT-PCR analysis from bovine BCECs with limited BBB functions (Lim. BBB) or re-induced BBB functions (Re-ind. BBB). Analysis was performed using the primers and conditions described. (B) Western blot analysis: β-actin (ACTB), TNAP (ALPL) and EHD1 (EHD1) protein levels in Triton X-100 extracts from bovine BCECs. The Western blot analysis was performed using the antibodies and conditions described. Quantitative and statistical analyses were performed with Quantity One (RT-PCR) or TotalLab 100 (Western blots) and PRISM 5 software packages, respectively. The results correspond to the mean ± SEM from three distinct assays. * p<0.03; ** p<0.002; NS: non-significant (in an unpaired t-test for RT-PCR and a paired t-test for Western blots). The expression of β-actin was monitored as a sample quality control.
