
Figure 6. Down-regulation of RanBPM expression enhances cellular transformation.
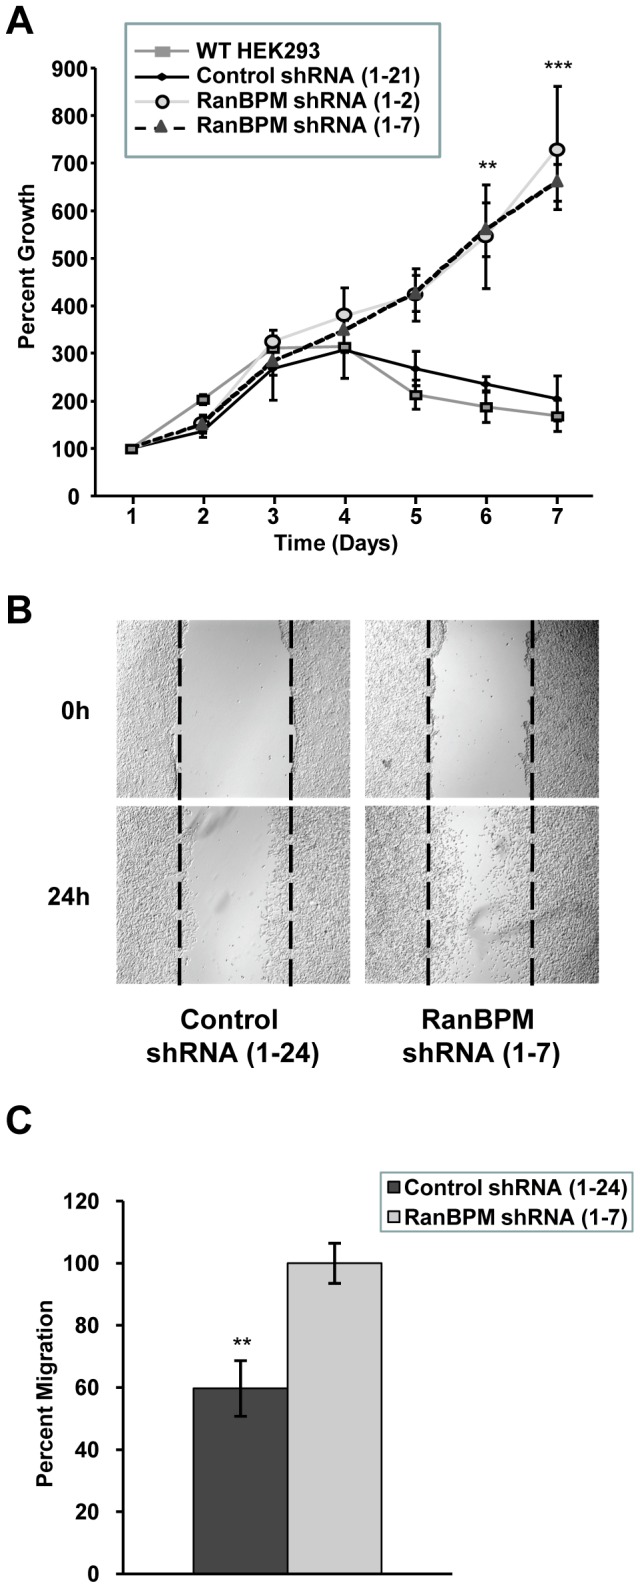
(A) RanBPM shRNA cells exhibit increased cell growth. Growth rates for HEK293 wild-type (WT), control shRNA and RanBPM shRNA cells were assessed for 7 days. Data represents mean percent growth for four independent experiments, with error bars indicating SE. ** indicates P<0.01 and *** indicates P<0.001. (B) Confluent monolayers of control and RanBPM shRNA HEK293 cells were cultured in the presence of 2 mM hydroxyurea for 24 h, scratched using a sterile pipette tip and wound healing was assessed at the indicated time points using a microscope at 4× magnification. Images from a representative experiment are shown. (C) Percent wound closure was calculated for control and RanBPM shRNA HEK293 cells. Data represents the mean of four independent experiments with error bars representing SE, and ** indicating P<0.01.