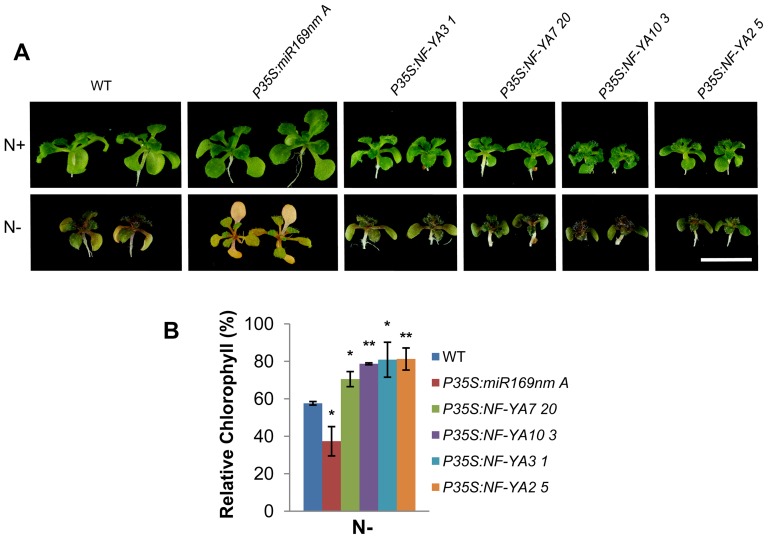
Figure 9. Plants overexpressing NF-YA display reduced N starvation induced senescence.
(A) Photograph of WT, P35S:NF-YA and P35S:miR169nm plants grown for 2 weeks on N+ (N optimum) or N− (N limited) media under standard light/dark cycle. Bar = 10 mm. (B) Relative chlorophyll contents of WT and overexpressing plants grown on N contrasting conditions. Total chlorophyll content was measured, normalized per gram fresh weight of sample and used to calculate the relative content (expressed as a percent of the value for the same line growing on N optimum, set to 100%). Values are means and SD of three independent experiments. Statistically significant differences using the student t-test between WT and transgenic lines are indicated (*P<0.05, **P<0.01).

