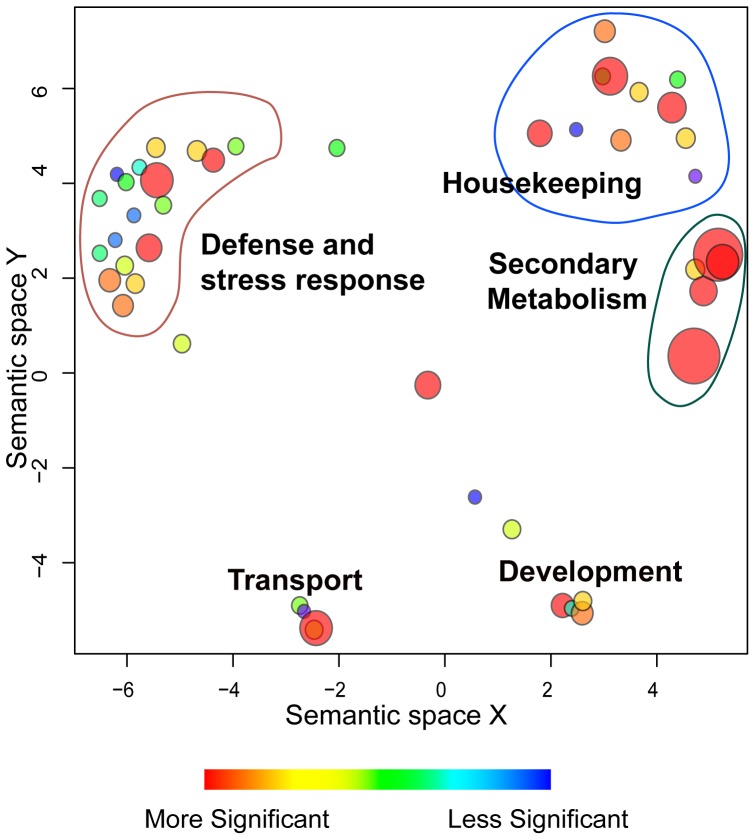
Figure 7. Gene Ontology (GO) terms identified in the genes associated with low-parent like small RNA level and between LP and MP small RNA level.
The GO terms are represented by circles, visualized in a semantic similarity-based scatter plot, where similar GO terms are close to each other, using software ReviGO. The area of the circle is proportional to the significance of the over-representation of the GO term (-log10 p-value). The color of the circles represents the statistical significance of the over-representation of the GO term, as shown in the legend. The GO term annotations are in Supplemental Table S2.

