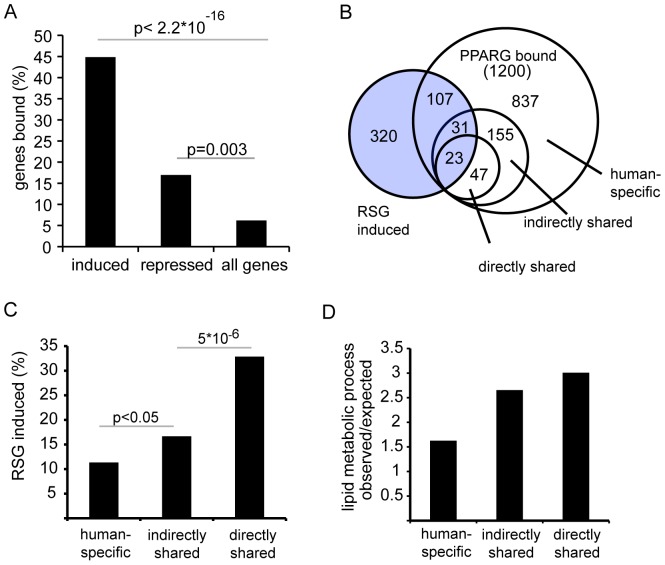
Figure 4. Conservation reveals functional PPARG/RXR target genes.
A) Association of PPARG/RXR binding sites with RSG regulated genes in THP-1 cells. Significance of enrichment over background was calculated using Fisher's exact test. B) Venn diagram representing the overlap between PPARG/RXR bound genes and RSG regulated genes across the different conservation categories. Indicated are the numbers of genes exclusive to the respective gene sets. C) Proportion of non-conserved, indirectly and directly shared target genes that are induced by RSG. Significance was calculated using Fisher's exact test. D) Bar plot showing the ratio of expected versus observed number of genes associated with the biological process category ‘lipid metabolic processes’ obtained from PANTHER for human-specific, indirectly and directly shared target genes.

