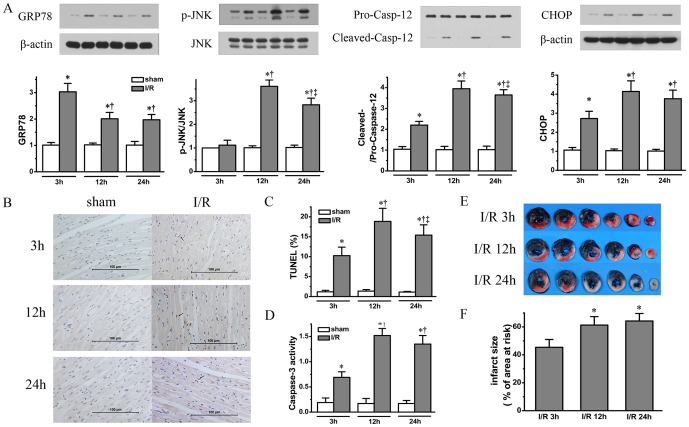
Figure 1. Time course increases in I/R injury associated with dynamic changes in ER stress signalings.
In panel A, ER stress related protein markers including GRP78, phosphorylation level of JNK, cleaved Caspase-12 band and CHOP were quantified for IR rats in comparison with Sham operated rats. Apoptosis signaling was assessed by TUNEL staining using paraffin embedded heart tissue (Panel B) with bar graph showing percentage TUNEL staining positive cells (Panel C). Caspase-3 activity was also quantified (Panel D) (n = 6 for I/R group and n = 4 for sham group at each time point). Representative sequential LV slices obtained from each group in panel E show both area at risk demarcated with Evans blue staining for normal heart tissue and area of necrosis with 2,3,5-triphenyltetrazolium chloride staining (pale area = infarcted tissue). The bar graph shows the percentage of LV weight of infarct area over LV weight at area at risk (Panel F), demonstrating time course changes in infarct size at 3, 12 and 24 hours of reperfusion following 45 minutes ischemia (n = 8 for each time point/group). All the data presented in the bar graphs were expressed as mean±SD. * denotes P<0.05 vs. Sham groups; †, P<0.05 vs. I/R group at 3 hours of reperfusion and ‡, P<0.05 vs. I/R group at 12 hours of reperfusion.

