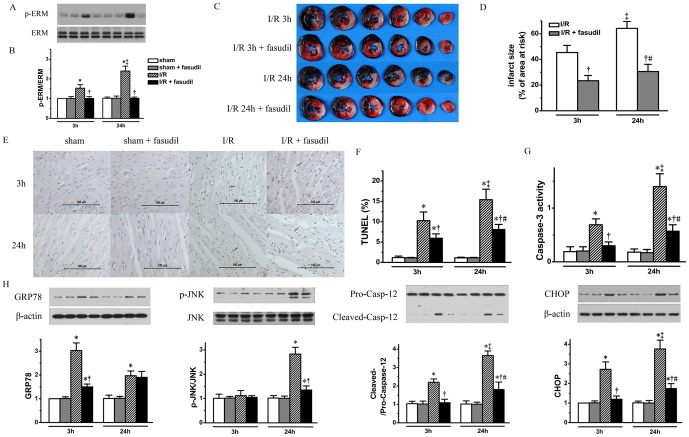
Figure 2. ROCK inhibition results in decreases in both I/R injury and ER stress activation.
Representative bands of phosphorylated and total ERM (Panel A) with quantification shown in bar graph (Panel B) demonstrating that ERM was activated during I/R injury process and can be suppressed by fasudil infusion (n = 4 for sham operated and 6 for I/R group rats with or without fasudil therapy for each time point). IS was measured for I/R rats receiving placebo or fasudil therapy at both 3 and 24 hours (n = 8 for each group at each time point) after reperfusion with representative sequential heart slices shown in Panel C and IS quantification shown in bar graph (Panel D). Using the same rat heart samples as shown in Panel A, paraffin embedded heart tissue slices from LV papillary muscle level, TUNEL staining (Panel E) was perform with percentage of TUNEL staining positive cells quantification shown in bar graph (Panel F). Using heart tissue from risk area Caspase-3 activity (Panel G) was measured to quantify apoptosis. ER stress related apoptosis signaling was also quantified by measuring its protein markers including GRP78, p-JNK, cleaved Caspase-12 and CHOP, with representative bands quantified in corresponding bar graph (Panel H). All data expressed as mean±SD. * denotes P<0.05 vs. Sham groups; †, P<0.05 vs. I/R group at the same time point; ‡, P<0.05 vs. I/R group at 3 hours of reperfusion and #, P<0.05 vs. I/R+fasudil group at 3 hours of reperfusion.

