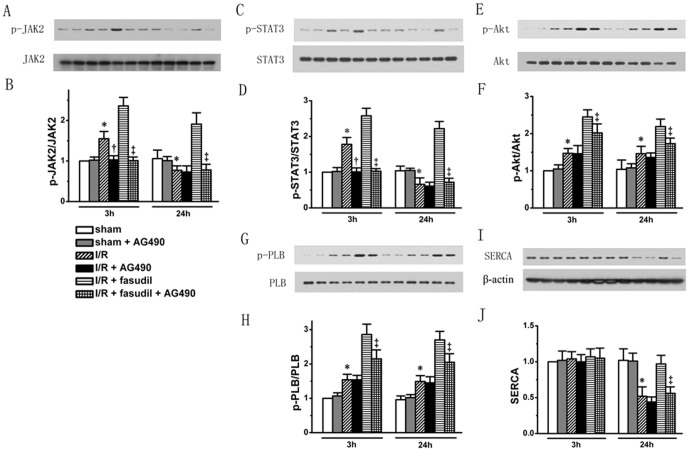
Figure 8. The role for JAK2/STAT3 signaling pathway was also tested by using pharmacological inhibitor.
Sham group, I/R group and I/R+fasudil group were either given AG490 or placebo (n = 6 for each group rats treated with AG490 for both time points, all the other rats are the same as shown in above). Western blotting was performed, targeting phosphorylation levels of Akt (Panel A showed representative protein bands for each group with quantification shown in bar graph in Panel B), JAK2 (Panel C & D), STAT3 (Panel E & F) and PLB (Panel G & H). SERCA protein expression levels (Panel I & J) were also analyzed. All data expressed as mean±SD. * denotes P<0.05 vs. Sham groups at the same time point; †, P<0.05 vs. I/R group at the same time point and ‡, P<0.05 vs. I/R+fasudil group at the same time point.

