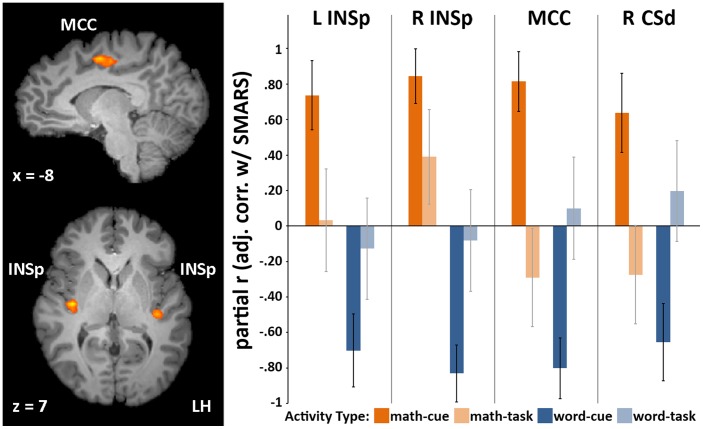
Figure 1. Whole-brain and ROI regression results.
Left: Regions showing a significant SMARS × 2(Cue: math-cue, word-cue) interaction at the whole brain level (p<.005, cluster-corrected at α = .01). INSp: dorso-posterior insula; MCC: mid-cingulate cortex; CSd: dorsal central sulcus (not pictured); see Table 2 (left) for complete region details. Right: Multiple-regression adjusted partial r correlation coefficients (error-bars represent standard-errors). This is the correlation that remains between the DV (SMARS) and the IV in question, after removing the linear effects of the other three IVs from both variables; IVs = neural-activity: math-cue, math-task, word-cue, word-task. See Table 2 (center) for full regression results. SMARS was chosen as a DV to compare the relative contributions of the various cue and task βs, and in no way implies a causal relation. Note that these bars should not be interpreted as activity levels (i.e., βs relative to baseline), but as partial correlations; see Table 2 for mean βs.

