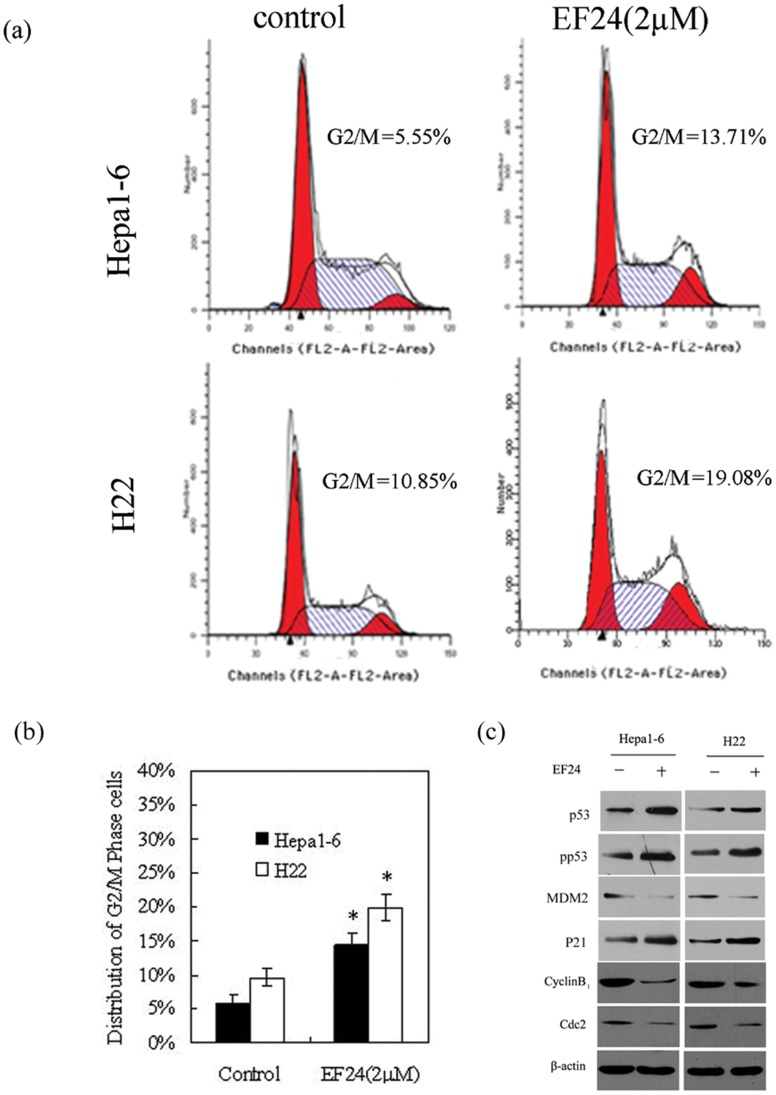
Figure 2. EF24 induces cell cycle arrest in mouse liver cancer.
Cells were treated with either DMSO (control) or EF24 (4 µΜ) for 48 h were collected, flow cytometric analysis was performed for cell cycle distribution. (a). Representative flow cytometry graph for each treated or untreated groups. (b). Distribution of G2/M phase cells. Data represent mean ± SD of three independent experiments, *p<0.05 as compared with control group. (c). Immunoblot images of cell cycle regulatory molecules CycB1, Cdc2, p53, pp53, p21, MDM2 from treated (EF24, 4 µM, is denoted by “+”) and untreated (is denoted by “−”) cells.

