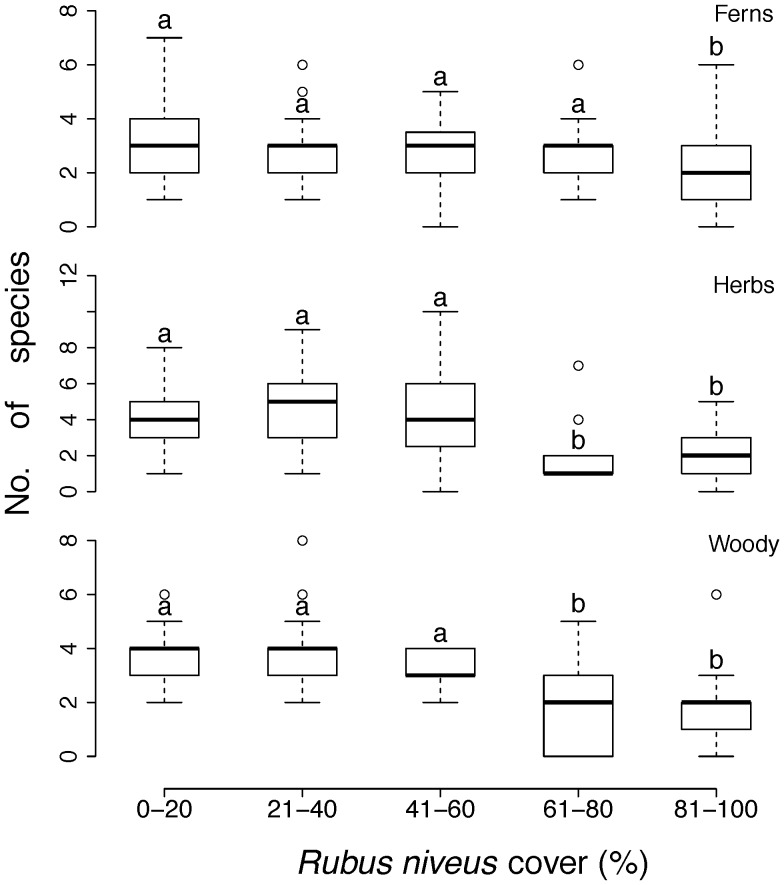
Figure 3. Relationship between R. niveus cover categories and total species richness by growth form (vines are included within herbs and woody species include shrubs and trees) and woody (shrubs and trees).
Lines within the box represent the median values of the number of species found within each invasion category; the bottom and top edges of the box represent 25th and 75th percentiles of all data, respectively; the bottom and top bars represent 5th and 95th percentiles. ANOVA-GLM (quasi-Poisson error distribution); ferns: F4,119 = 3.55, P = 0.009; herbs: F4,119 = 11.44, P = 0.009, woody species: F4,119 = 13.13, P<0.001 (a,bdenote group differences detected by statistical analyses amongst R. niveus cover categories).

