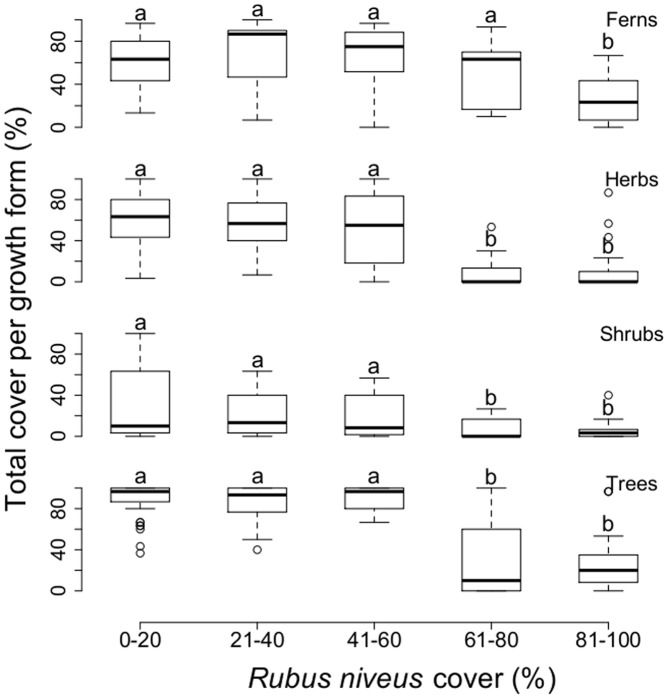
Figure 4. Relationship between R. niveus cover categories and total species cover by growth form.
Lines within the box represent the median values of cover within each invasion category; the bottom and top edges of the box represent 25th and 75th percentiles of all data, respectively; the bottom and top bars represent 5th and 95th percentiles. ANOVA-GLM (quasi-Binomial error distribution); ferns: F4,119 = 9.54, P<0.001; herbs: F4,119 = 20.86, P<0.001, shrubs: F4,119 = 7.27, P<0.001; trees: F4,119 = 35.41, P<0.001 (a,bdenote group differences detected by statistical analyses amongst R. niveus cover categories).

