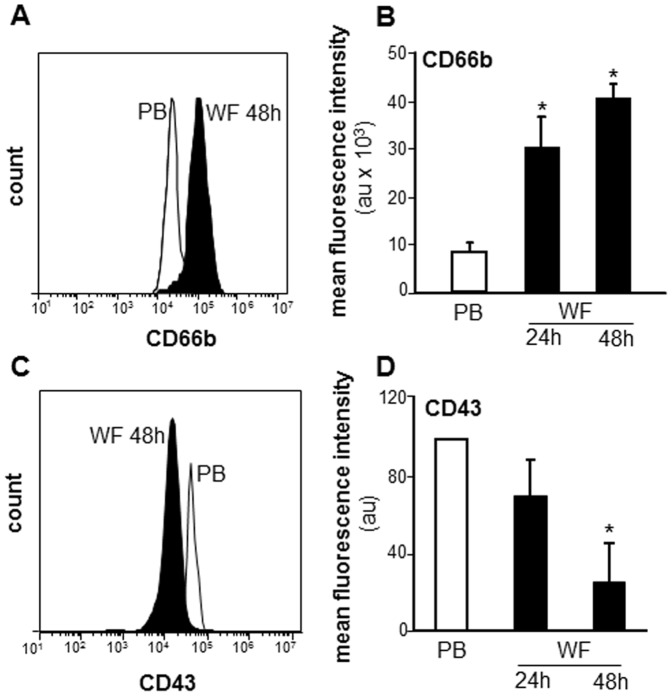
Figure 4. Cells from WF show activated PMN phenotype: increased CD66b and decreased CD43 expression.
The WF and PB cells were subjected to flow cytometry analysis following immunostaining with CD66b or CD43. A&C, representative flowcytometry histograms of CD66b and CD43; B&D, quantification of CD66b and CD43 flow cytometry analysis. Data presented as mean±SD, n = 4. *p<0.05 compared to PB.

