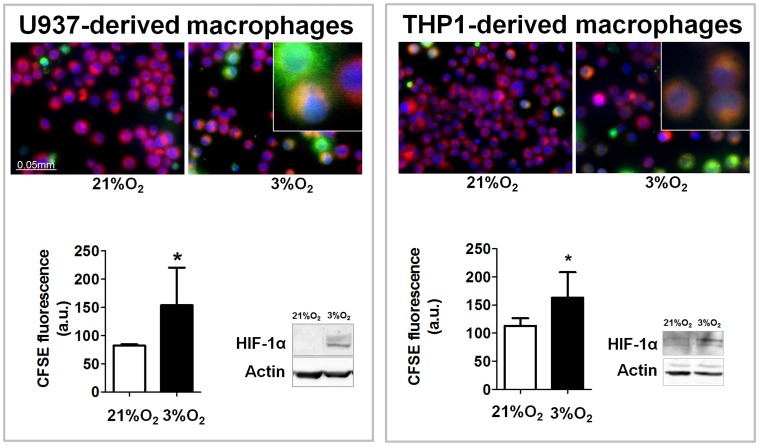
Figure 1. Hypoxia increases phagocytosis of apoptotic neutrophils by human macrophages.
Representative images show phagocytosis of apoptotic neutrophils by U937 or THP1 cells in normoxia and hypoxia. In all cases blue staining identifies the nuclei, red staining defines the cytoplasm of the cells, and green staining indicates neutrophils. This system automatically counts the total number of cell nuclei per field and the number of cells exhibiting green fluorescence on red fluorescence (phagocytic cells). Inserts show magnification of the image. Results are expressed as intensity of fluorescence in arbitrary units. Bars in the graphs represent mean± SEM (n>3). Groups were compared using t-test analysis. Significant difference from the respective group in normoxic conditions is shown by *P<0.05. Western blot showing HIF-1α stabilization induced by hypoxia in U937 or THP1 cells.

