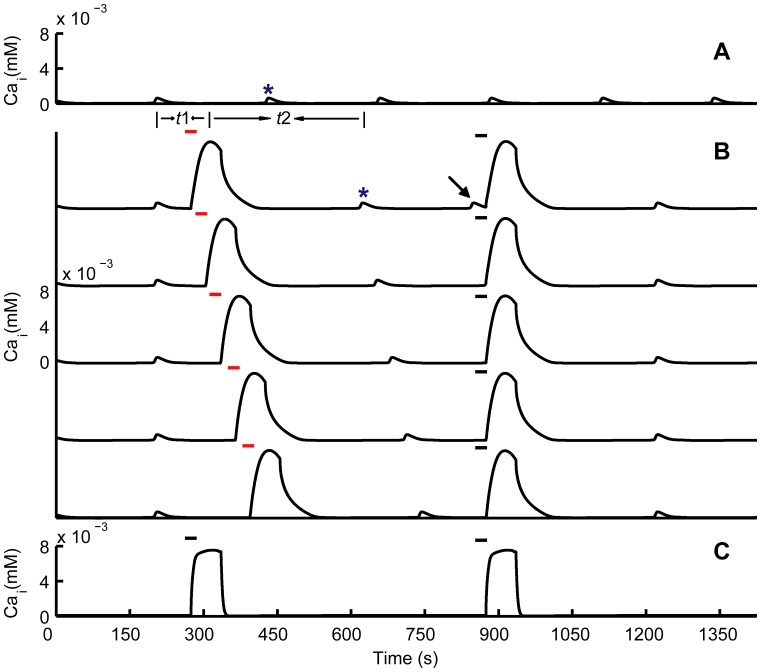
Figure 5. Interactions between CASs and CSDCWs.
(A) A series of CASs occur without any stimulus. (B) The appearance of CSDCWs depresses CASs, and CASs reappear a few minutes after the pass of CSDCWs (the affected CASs are marked with asterisks in A and B). CSDCWs can appear immediately after CASs (marked with an arrow in B). By regulating the appearance time of CSDCWs through changing the time points of locally elevating K o (marked with red bars in B), the peak-to-peak interval between the CSDCW and the following CAS is similar, and it is not related to the peak-to-peak interval between the CSDCW and the previous CAS. t1, the peak-to-peak interval between the CSDCW and the previous CAS. t2, the peak-to-peak interval between the CSDCW and the following CAS. (C) Depletion of Ca2+ stores in the ER abolishes CASs, but CSDCWs still spread. The bar illustrates the time of locally elevating K o.

