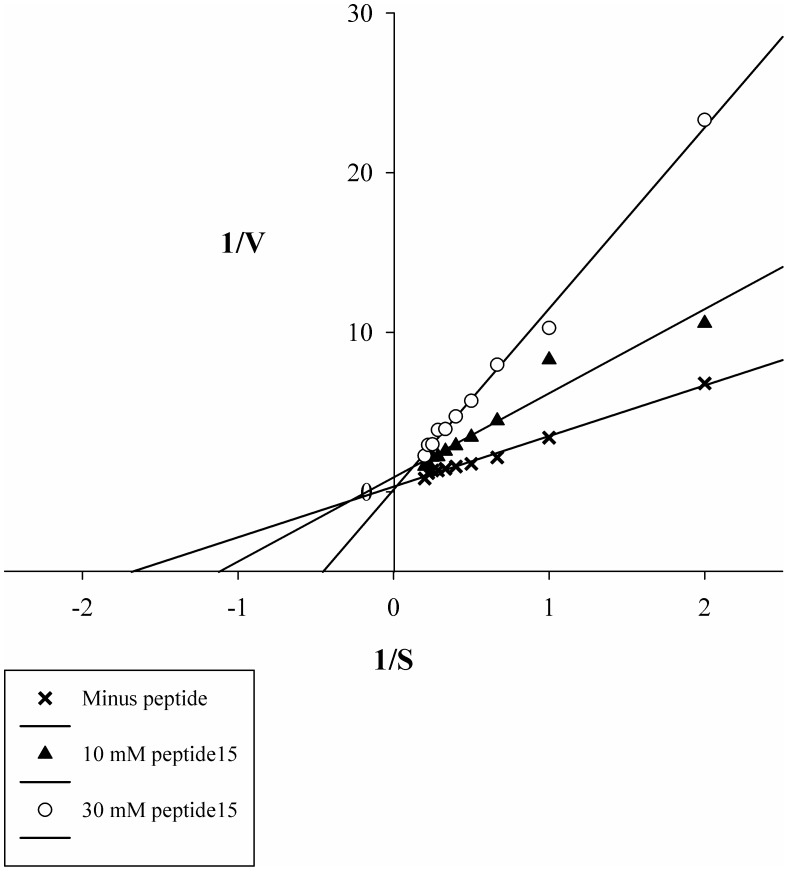
Figure 3. Peptide15 displays the characteristics of a competitive inhibitor.
Shown are 1/V-1/S plot of peptide15 inhibition of Kly18. Kly18 was pre-incubated with fixed concentrations of peptide15 (10 µM and 30 µM) for 30 minutes, followed by incubation with varying concentrations of FITC-casein (5–50 µg/ml). As seen from the Lineweaver-Burke plot the Y-intercept is approximately the same for un-inhibited Kly18 as Kly18 inhibited with 10 µM and 30 µM, respectively. This suggested that peptide15 was a competitive inhibitor of Kly18. Linear regression lines were made using SigmaPlot 11.0. Data represent mean values from three experiments per substrate concentration.

