
Figure 1. TetA-YFP fluorescence.
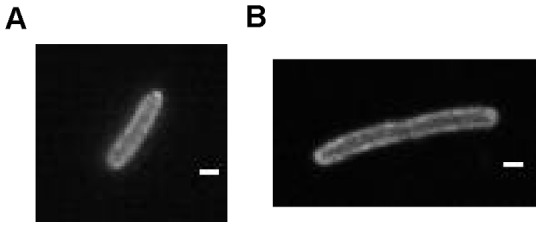
Fluorescence images of cells expressing TetA-YFP. (A) A cell growing in minimal glucose medium. (B) A cell grown with cephalexin, causing filamentation, in order to perform FRAP measurements (see Methods). The scale bars indicate 1 µm.