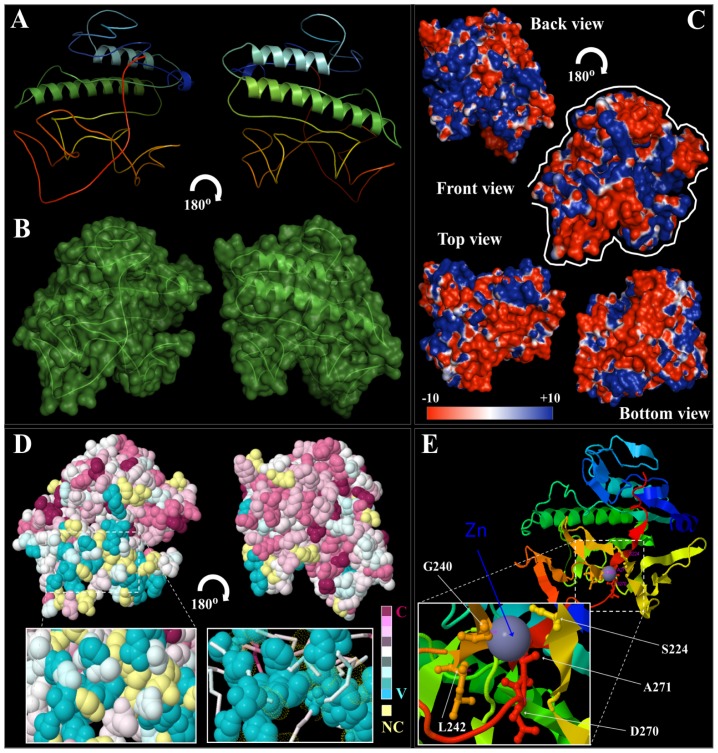
Figure 8. Detailed structural conformation and conservation analysis of Retrosat2, a rice ORF0 protein member.
(A) General structure (cartoon diagram rainbow colored) shows the 2D structural elements of the rice RetroSat2, where N- and C-terminal are colored blue and red, respectively. Represented structures were rotated at 180u. (B) The surface conformation of RetroSat2 (rotated 180u) showing the secondary structure elements inside is depicted. (C) Electrostatic surface potential showing front, back, top and bottom views of RetroSat2 structure. The surface colors are clamped at red (−10) or blue (+10). Top and bottom views are highlighted with a white line coming from front view. (D) Best predicted RetroSat2 model (2D-structure) was subject to consurf-conservational analysis searching for close homologous sequences with known structures using PSI-BLAST. The protein was finally visualized using FirstGlance in Jmol with the conservation scores being color-coded. The conserved and variable residues are presented as space-filled models and colored according to the conservation scores. A detailed view of the predicted ligand-binding cavity holding up the cofactor/ligand (van der Walls spheres and/or lines) is shown in high magnification. Represented structures were rotated at 180u. (E) Cartoon structural representation of a general front view of RetroSat2 model (C- and N-terminal colored as blue and red respectively), showing the morphology of the predicted cofactor/ligand-binding pocket/cavity. A detailed view at higher magnification highlights the residues implicated in cavity formation and interaction with the ligand zinc (Zn), which are S224, G240, L242, D270, and A271.

