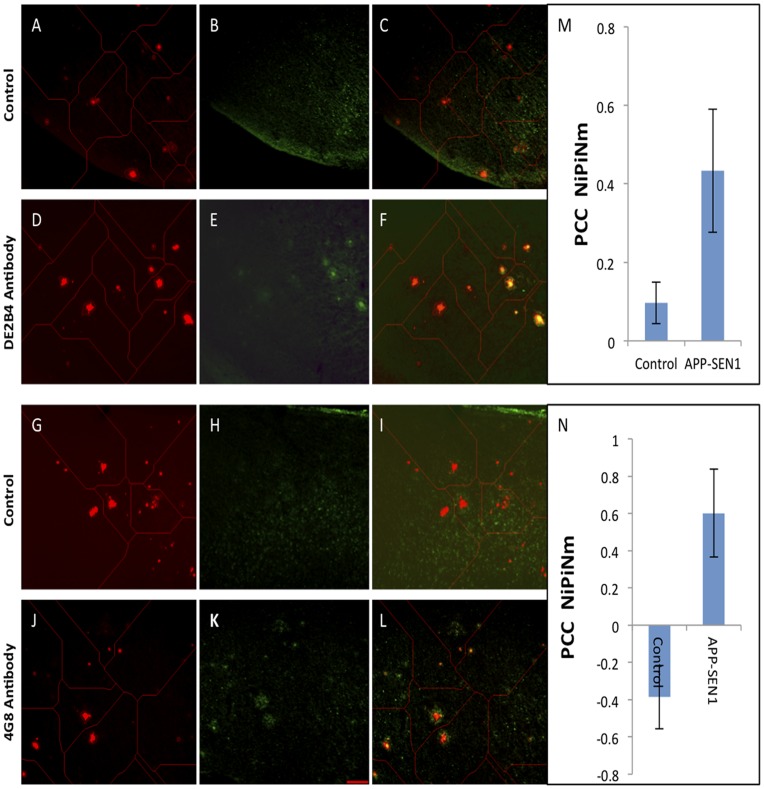
Figure 9. Immunostained brain sections show co-localization of in vivo targeted liposomes with anti mouse β-amyloid antibodies.
Brain sections from mice injected with targeted liposomes (A, D, G, J) were probed with two different anti-amyloid antibodies (DE2B4 and 4G8), whose localization was then visualized using a FITC-labeled (E) and cy5-tagged Dylight649 (K) rabbit-antimouse polyclonal antibody. Control sections (B and H) were treated with saline instead of the antiamyloid antibody and then identically stained with the respective rabbit-antimouse polyclonal antibodies. Images shown are representatives from 5 slices collected from 4 mice in each group. All images were used for quantitative analysis: In each image, the punctate XO4 signal was used to tessellate the field around each focal plaque (shown by the thin red lines in each image) and create contiguous subdomains within which the colocalization could be assessed. Each subdomain was masked into two regions: the “nuclear” region corresponding to the pixels of the XO4 signal, and the “protein” region, corresponding to all other pixels in the subdomain. Co-localization was then quantified by the Pearson’s Correlation coefficient (PCC) of nuclear intensity versus protein intensity over nuclear mask (PCC NiPiNm). All calculations were performed using Cytseer software (Vala Sciences). The graphs (M and N) to the right of the images show the PCC values for each treatment. Means and standard deviations calculated over 156 focal plaques for the DE2-B4 antibody and 40 focal plaques for the 4G8 antibody.

