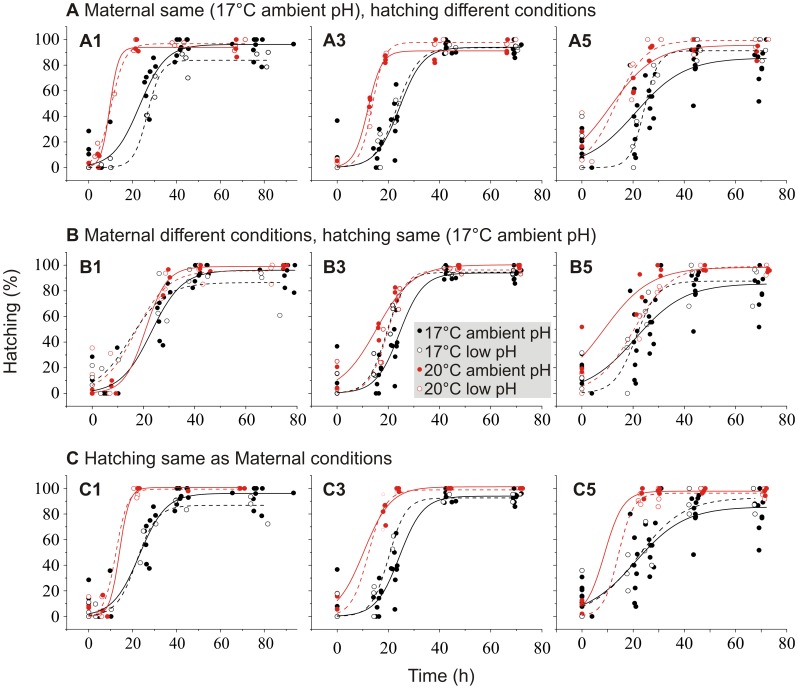
Figure 4. Cumulative hatching of eggs in transplantation experiment.
Eggs are A1, A3 A5) produced at 17°C ambient pH on days 1, 3 and 5, but hatched in different conditions, B1, B3, B5) produced in different conditions on days 1, 3 and 5, but hatched at 17°C ambient pH, C1, C3, C5) hatched in same conditions that they are produced on days 1, 3 and 5. Best fit, sigmoidal curves: black line = 17°C ambient pH, black dashed line = 17°C low pH, red line = 20°C ambient pH, red dashed line = 20°C low pH.

