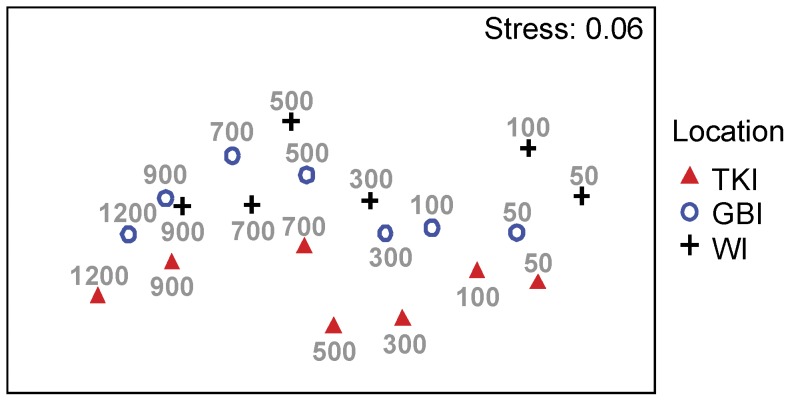
Figure 2. Ordination of fish assemblages with depth at each of three New Zealand locations.
Non-metric MDS plot on the basis of Jaccard resemblances between fish assemblages consisting of averages from n = 6 baited remote underwater stereo-video system deployments within each combination of depth (50, 100, 300, 500, 700, 900 or 1200 m) and location (White Island, Great Barrier Island or the Three Kings Islands).

