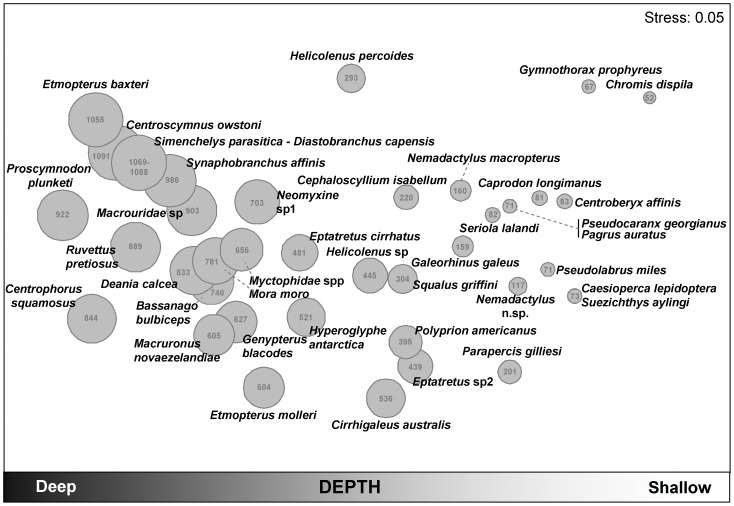
Figure 6. Ordination of fish species associations, with average depth as bubbles.
Non-metric MDS plot of the Jaccard resemblances among the 40 most important fish species in the dataset, based on their frequencies of occurrences. Species which co-occur together often will have high Jaccard similarity, and will be placed by the nMDS algorithm relatively close together on the plot. The 40 most important species are those which, for every sample, account for >5–6% of a sample’s total abundance. The relative average depth of the samples at which each species occurred is shown using scaled bubbles. The average depth (in metres) at which each species was recorded is also shown numerically in the centre of each bubble.

