
Figure 3. Shear stress bioreactor mechanical validation.
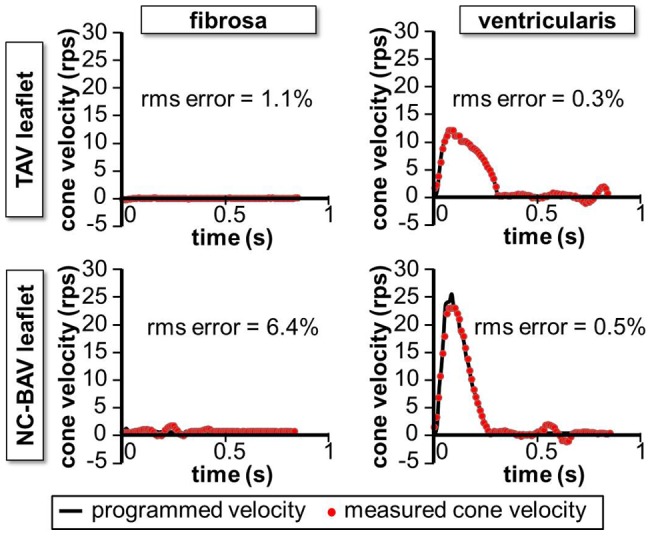
Comparison between the programmed and measured cone angular velocities for the production of the TAV and NC-BAV ventricularis and fibrosa WSS (rms error expressed as a percentage of the maximum shear stress range experienced by the leaflet over one cardiac cycle).