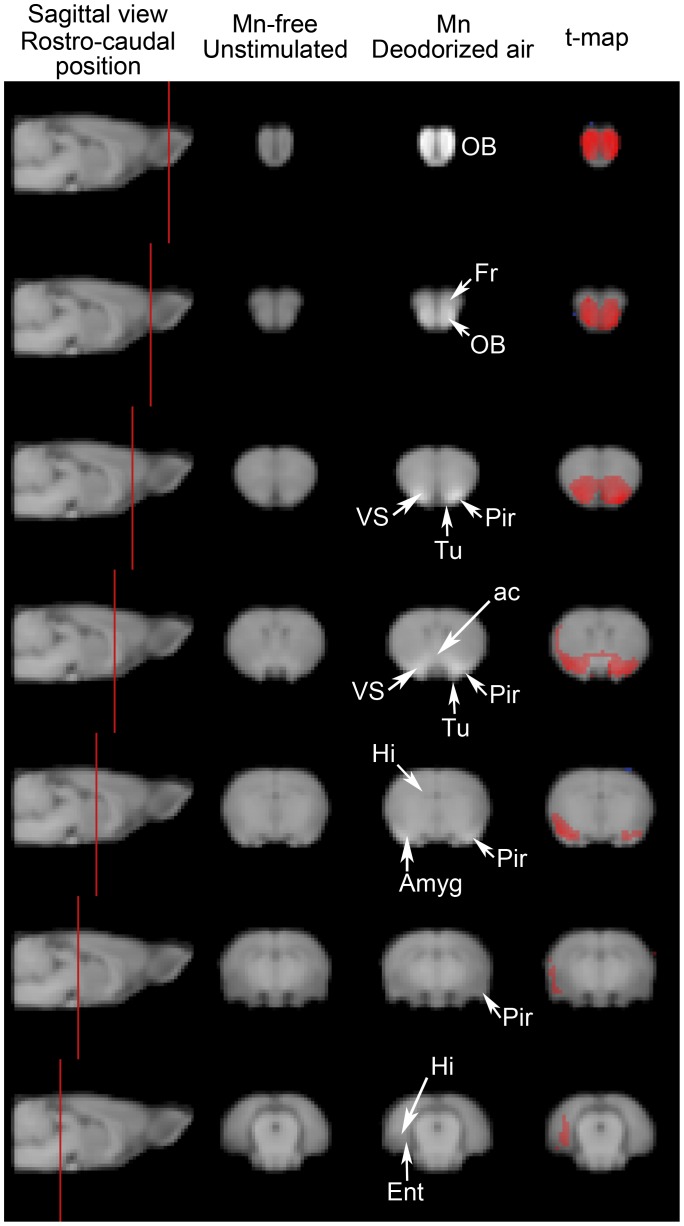
Figure 1. Figure.
1. Mn accumulation along olfactory pathways in the absence of olfactory stimulation. T1-weighted MEMRI images were obtained from the 9 rats that did not receive any Mn and were not submitted to any odorous stimulation and from the 7 rats that received 0.3 µmol Mn intranasally and were exposed to a continuous flow of deodorized air. The 16 MEMRI images were normalized both spatially and in intensity as described in the text. The mean intensity values of homologous voxels in the 2 groups were then compared using a Student’s two-tailed t-test. Left column: a parasagittal view of the rat brain intersected by vertical red lines indicating the position, along the rostro-caudal axis, of the coronal sections shown in the three other columns. Center columns: coronal sections through the T1-weighted normalized MEMRI images of the 9 Mn-free unstimulated rats (left) and the 7 Mn-injected rats exposed to deodorized air (right). Right column: statistical t-map overlaid on T1-weighted MEMRI image showing Mn enhancement. T-values in red represent voxels whose mean intensity in the Mn group was higher than that of their homologues in the Mn-free group (p<0.001). Abbreviations: ac anterior commissure, Amyg Amygdaloid nuclei, Ent entorhinal cortex, Fr frontal cortex, Hi hippocampus, OB olfactory bulb, Pir piriform cortex, Tu olfactory tubercle, VS ventral striatum.

