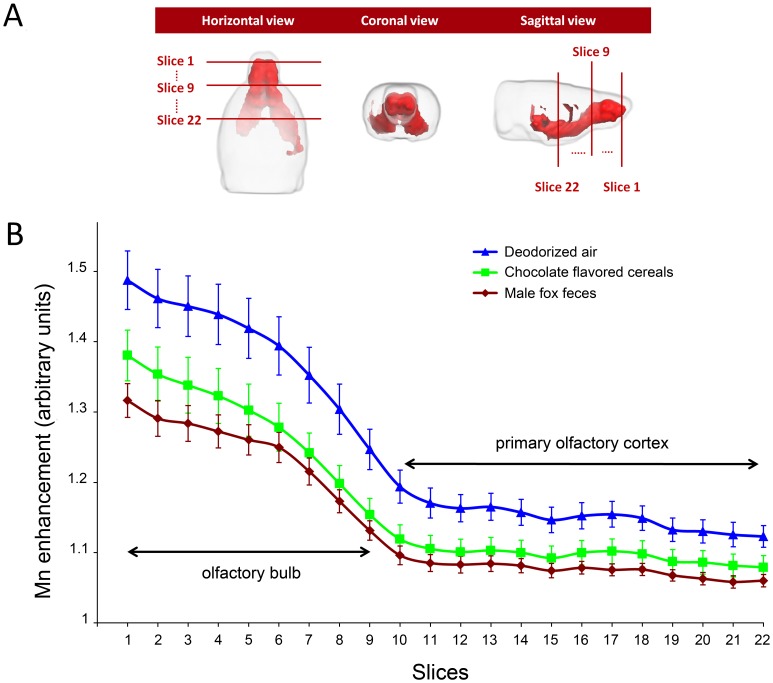
Figure 2. Effect of odorous stimulation on Mn enhancement along the olfactory pathways.
(A) 3D views of the t-map shown in the right column of Figure 1. The intersection of this t-map and coronal planes at 22 rostro-caudal levels, (3 levels are shown: 1, 9 and 22) defined a region of interest (ROI) in which Mn enhancement was averaged to assess the effect of odorous stimulation. (B) Rostro-caudal distribution of the mean Mn enhancement in the 3 stimulated groups. At each level, the mean (± sem) Mn enhancement was calculated and compared using a one-way ANOVA. As indicated in the text, fox feces induced enhancement was always significantly different from deodorized air enhancement. Chocolate enhancement significantly differed from that of deodorized air only in slices 6 to 15 and in slice 17.

