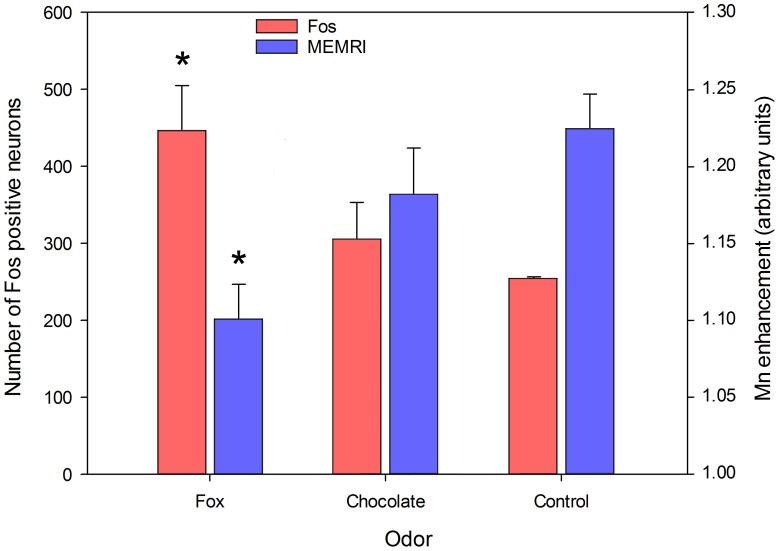
Figure 4. Comparison of c-Fos immunodetection and MEMRI signal.
Red bars: number of c-Fos+ neurons within the anterior piriform cortex of rats stimulated by the odors released by a receptacle either empty or containing chocolate flavored cereals or fox feces. Means ± s.e.m. are shown. *: p<0.05 when compared to the corresponding empty container (control) value. y-axis legend is on the left. Blue bars: Mn contrast enhancement within the anterior piriform cortex in ROIs homologous to the regions examined for Fos immunoreactivity (as shown in Figure 3). Odorous stimulation was an airflow odorized with either male fox feces or chocolate flavored cereals. Means ± s.e.m. are shown. *: p<0.05 when compared to the corresponding deodorized airflow (control) value. y-axis legend is on the right.

