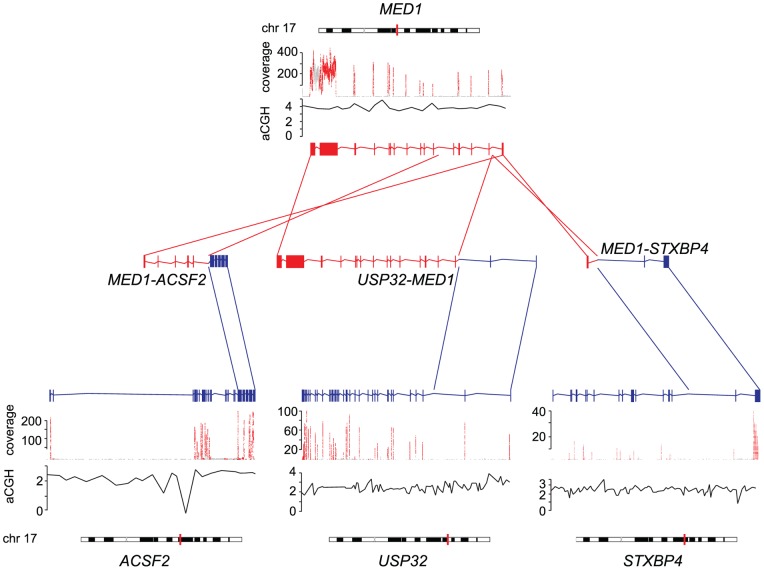
Figure 3. MED1 forms fusions with several partner genes.
Exonic expression of MED1 and its partner genes ACSF2, USP32 and STXBP4 is indicated by sequencing coverage (red). Copy number changes measured by aCGH (black lines) in reference to normal copy number (horizontal gray lines), and chromosomal positions (vertical red lines on chromosomes) are indicated. Transcript structures of wild type genes as well as gene fusions are indicated by red (MED1) and blue (ACSF2, USP32, STXBP4), and connected with lines of same color. Arrows show the 5′ 3′ direction of the genes.

