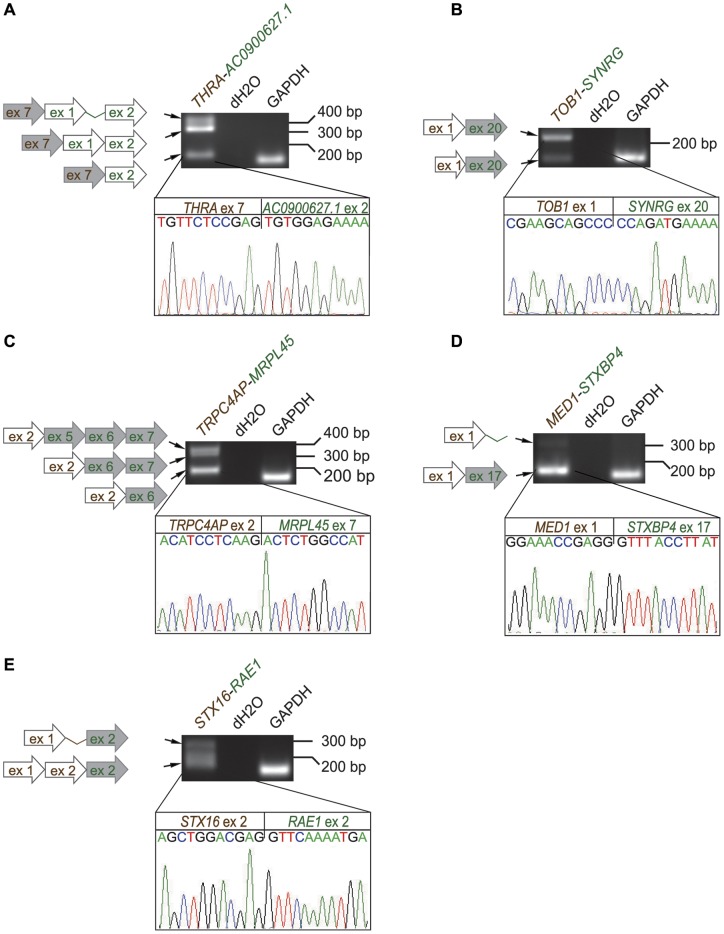
Figure 5. Several fusion transcripts have multiple splice variants.
Five examples from BT-474 (A. THRA-AC090067.1, B. TOB1-SYNRG, C. TRPC4AP-MRPL45, D. MED1-STXBP4 and E. STX16-RAE1) are presented. Multiple splice variants are visible as RT-PCR bands, and schematically represented by the arrows to the left. Chromatograms show the actual cDNA sequence break points of the main predicted fusion isoforms, and are connected with lines to the corresponding RT-PCR bands. Gray arrows = coding sequence, white arrows = untranslated exon or 3′/5′ UTR, thin lines connecting exons = intronic regions. 5′ partner genes are represented by brown color, 3′ partner genes by green.

