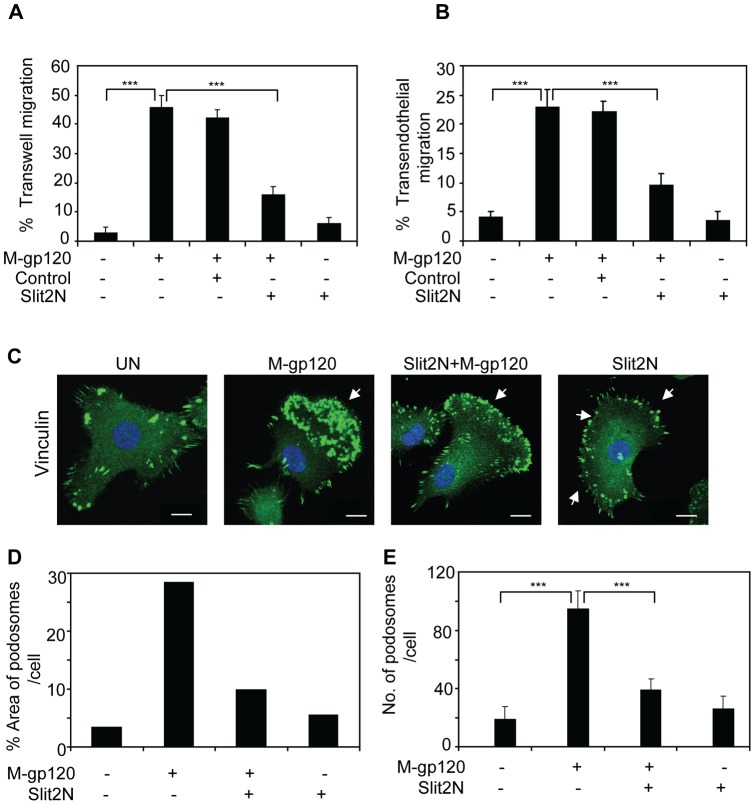
Figure 1. Slit2N inhibits HIV-1-gp120-induced migration and podosome formation of iMDDCs.
(A) iMDDC transwell migration: cells were incubated with Slit2N, Slit2 negative control, or media alone for 2 hours, then seeded to the upper compartments of transwell chambers. Media +/− M-gp120 or Slit2N was added to the bottom compartments of the chambers. After 3 hours, iMDDCs that had migrated to the lower chambers were counted by hemocytometer. Data indicate the mean ± SD of 5 independent experiments (***p≤0.001). (B) iMDDC transendothelial migration: HUVECs were seeded into the upper compartment of transwell chambers and incubated at 37°C, 5% CO2, to confluency. iMDDCs were incubated with Slit2N, Slit2 negative control, or media alone for 2 hours, then seeded to the upper compartments of transwell chambers. Media +/− M-gp120 or Slit2N was added to the bottom compartments of the chambers. After 8 hours, iMDDCs that had migrated to the lower chambers were counted by hemocytometer. Data indicate the mean ± SD of 5 independent experiments (***p≤0.001). (C) Vinculin expression by confocal microscopy. iMDDCs were cultured on chamber slides and left untreated or incubated with M-gp120, Slit2N then M-gp120, or Slit2N alone (Slit2N incubation: 2 hours; M-gp120 incubation: 1 hour) before fixing and staining cells. Green = Vinculin; Blue = DAPI. Scale bars = 2 µm. Arrows indicate a dense accumulation of podosomes at the cell's leading edge (“M-gp120” image), a reduced number of podosomes clustered at a weaker leading edge (“Slit2N + M-gp120” image), and a reduced number of podosomes localized around the cell's periphery (“Slit2N” image). Representative images are shown. (D) Percent of cell area covered by podosomes in the slides from Figure 1C, as described in Materials and Methods. (E) Number of podosomes per cells as described in Materials and Methods. Cells were treated as above. Data indicate the mean ± SD of 3 independent experiments x 50 cells per experimental condition (***p≤0.001).

