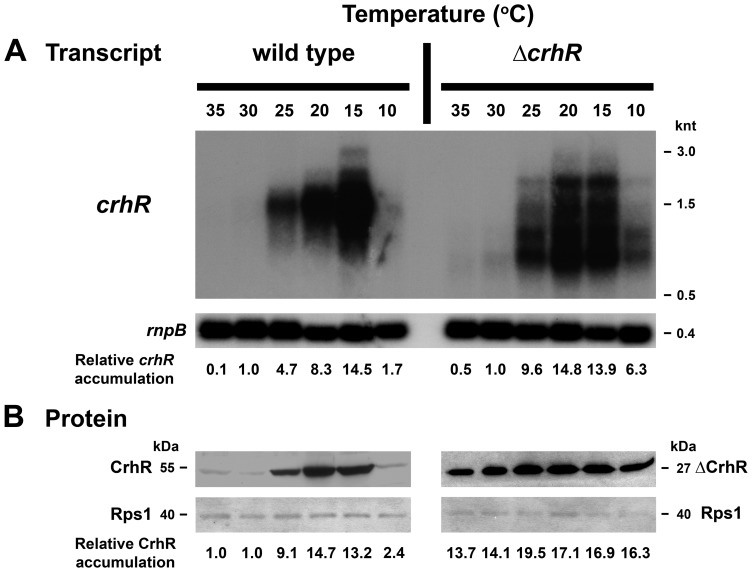
Figure 6. Temperature gradient of crhR expression.
Wild type and ΔcrhR Synechocystis were grown to mid-log phase at 30°C and divided into 6 aliquots, each of which was incubated at the indicated temperature for 1 h and samples were harvested for RNA and protein extraction. (A) Total RNA on a northern blot was probed with a 93 bp HincII-SacII internal fragment of crhR, stripped and probed with the Synechocystis rnpB gene as a control for RNA loading. crhR transcript levels were quantified at each temperature as described in Methods S1 and the fold change in crhR accumulation compared to the abundance in illuminated, wild type cells grown at 30°C (set to 1.0) is provided below each lane. Ethidium bromide staining of the RNA present on the Northern blot indicates that essentially equal quantities of RNA were loaded in each lane (Figure S1). (B) Western blots were probed with anti-CrhR antiserum and subsequently probed with antibodies against E. coli Rps1 as a control for protein loading. Protein levels were quantified at each temperature and the fold change in CrhR or ΔCrhR compared to the abundance in illuminated, wild type cells grown at 30°C (set to 1.0) is provided below each lane, as described in Methods S1.

