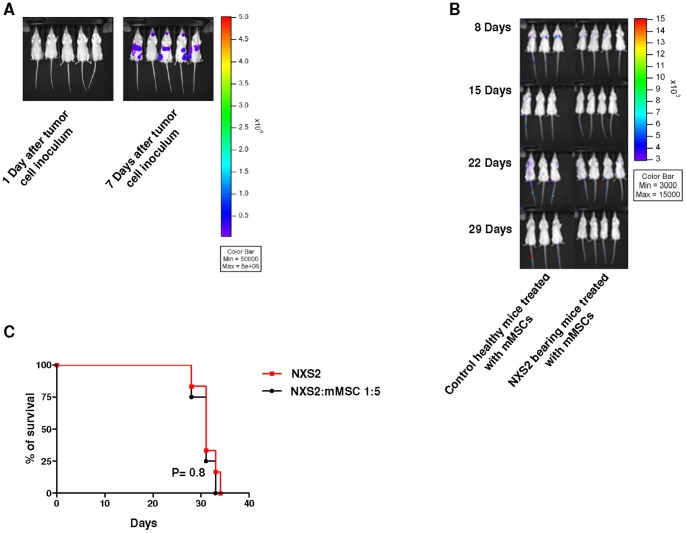
Figure 2. Survival curves and murine mesenchymal stem cell distribution within neuroblastoma bearing immunocompetent mice.
Panel A. A/J mice were injected in the tail vein with ffLUC-NXS2 cells (2×10⁵ cells/mouse; n = 5) and imaged by bioluminescence imaging 1 and 7 days after tumor cell inoculum. Panel B. A/J mice were i.v. injected or not with NXS2 cells (2×10⁵ cells/mouse) and treated with ffLUC-mMSC (1×10⁶ cells/mouse) 7 days after tumor cell inoculum. Control group included 3 healthy mice treated with mMSCs whereas NXS2 bearing mice group includes 4 mice injetced with NXS2 cells and treated with mMSCs. The animals were imaged by bioluminescence 8, 15, 22, 29 days after tumor cell inoculum. This is a representative experiment out of three performed. Panel C. A/J mice were inoculated in the tail vein with NXS2 cells (2×10⁵ cells/mouse) and treated with syngeneic ffLUC-mMSC (1×10⁶ cells/mouse) or saline seven days after tumor cell inoculum. Control group included 6 mice only injected with tumor cells, whereas mMSC-treated groups included 6 mice. Survival curves were constructed by using the Kaplan–Meier method. Statistical analysis of different treatment groups was performed by Peto's log-rank test. This is a representative experiment out of three performed.

