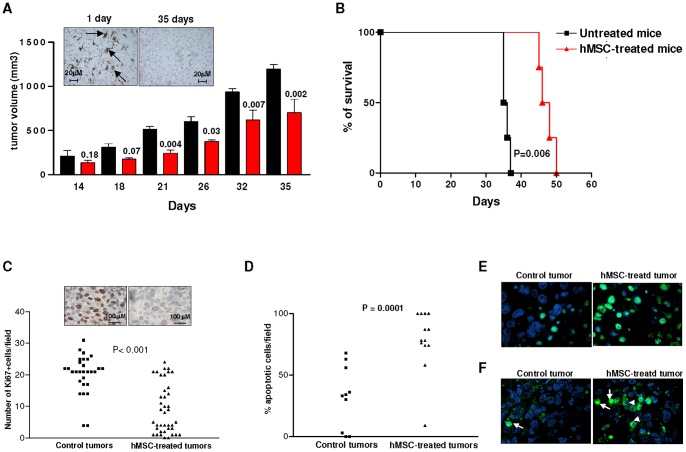
Figure 6. Effects of human mesenchymal stem cells after intratumoral injection in neuroblastoma tumors.
Panel A. Athymic mice were injected with human NB ACN cells (3×10⁶ cells/mouse) subcutaneously (s.c.) into the right flank. When the tumor size reached 100 mm3, hMSCs (1×10⁶ cells/mouse, 5 mice, red bars) or saline solution (control group: 5 mice, black bars) were injected intratumorally. Tumor volume was measured at different times and p values were calculated using Student's t test with Welch's correction. A representative experiment out of two performed is shown. Inset panel A shows a representative CD90 immunohistochemical staining of hMSC-treated ACN tumors surgically removed 1 day or 35 days after hMSC inoculum. Arrows indicate MSCs positive for CD90. Original magnification 40x. Panel B. Survival curves of ACN-bearing mice untreated or treated with hMScs were constructed by using the Kaplan–Meier method. Statistical analysis of different treatment groups was performed by Peto's log-rank test. This is a representative experiment out of two performed. Panel C. Paraffin-embedded tumor sections from control and hMSC-treated mice were stained for the cell proliferation marker Ki67. Data are expressed as mean value of Ki67 positive cells counted in 10 fields/slide. Inset panel B shows a representative staining of control and hMSC-treated ACN tumors with Ki67. Original magnification 100x. P values were calculated using Unpaired t test with Welch's correction. Panel D. Paraffin-embedded tumor sections from control and hMSC-treated mice were stained for detection of apoptosis with terminal deoxynucleotidyl transferase-mediated dUTP nick end labeling [TUNEL] assay. Data are expressed as mean value of TUNEL positive cells counted in 10 fields/slide. p values were calculated using Unpaired t test with Welch's correction. Panel E. Representative staining of control and hMSC-treated ACN tumors with TUNEL. Green cells are TUNEL positive. Panel F. Representative immunofluorescent staining of control and hMSC-treated ACN tumors with anti-caspase-3 mAb. Arrow indicate positive cells with nuclear activated caspase-3 localization; arrowheads indicate positive cells with cytosolic activated caspase-3 localization.

