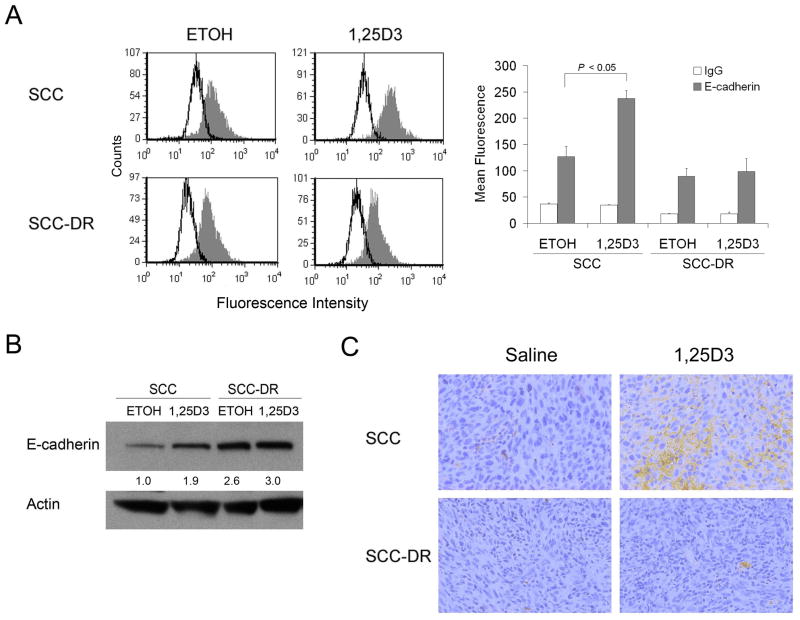
Figure 4.
1,25D3 enhances E-cadherin expression in SCC cells. (A) SCC or SCC-DR cells were treated with ETOH or 10 nM 1,25D3 for 48 h. E-cadherin expression level was assessed by flow cytometry. The data were displayed as histograms. Open peak, control IgG; gray peak, E-cadherin. The mean fluorescence was used to quantify the signals and presented in a bar graph. (B) SCC or SCC-DR cells were treated with ETOH or 10 nM 1,25D3 for 48 h. E-cadherin expression level was assessed by immunoblot analysis. Actin was the loading control. Densities of E-cadherin bands were presented as fold changes normalized to ETOH control of SCC cells. (C) E-cadherin expression (brown staining) was examined by immunohistochemistry in SCC xenograft tumor tissues in mice treated with saline or 1,25D3.

