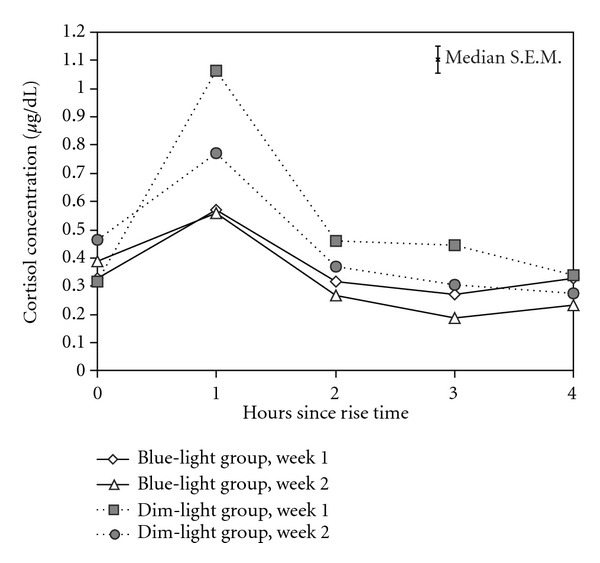
Figure 1.

Mean morning cortisol concentrations collected at the end of week 1 and of week 2 for both groups collected at rise time (zero hours since rise time) and for 4 consecutive hours after rising. Open symbols refer to the blue-light group (diamonds = week 1 and triangles = week 2) and closed symbols refer to the dim-light group (squares = week 1 and circles = week 2). A median value for the standard error of the means (S.E.M.) is shown on the top right quarter of the graph.
