Fig. 1.
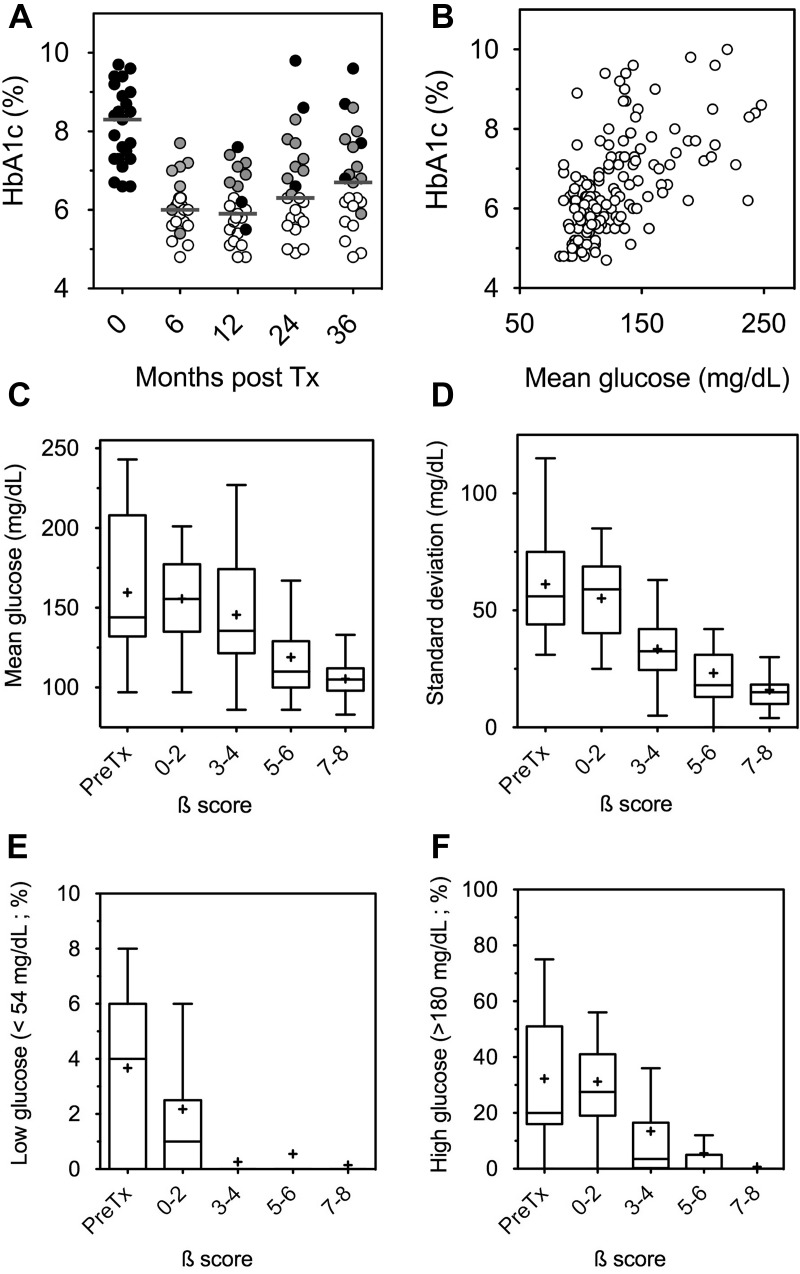
Outcomes of continuous glucose measurement. A, HbA1c values in the 23 patients during the 3-yr follow-up. The gray bar indicates the median value. Open symbols indicate optimal function (insulin independence with HbA1c ≤6.5%), gray symbols indicate partial graft function, and black symbols indicate no graft function. B, Association between HbA1c and mean glucose throughout the 3-yr follow-up of the entire cohort [n = 154; Spearman's correlation coefficient r = 0.58 (95% CI = 0.46–0.67); P < 0.001]. C–F, Reciprocal association between graft function (β-score; see Patients and Methods) and the various outcomes of continuous glucose measurement throughout the 3-yr follow-up in the entire cohort (n = 23) (β-score 0–2, n = 17; β-score 3–4, n = 19; β-score 5–6, n = 20; β-score 7–8, n = 55). Tukey box plots indicate median, IQR (boxes), and upper and lower range (whiskers). MG, GSD, and time spent with HYPER and HYPO were significantly lower after IT (P < 0.05 vs. baseline). Tx, Transplantation.

